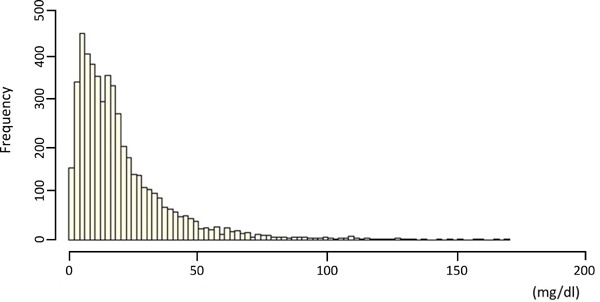
Fig. 2.

The distribution of the lipoprotein [Lp(a)] frequency
The X-axis represents the serum Lp(a) level, while the Y-axis represents the frequency.

The distribution of the lipoprotein [Lp(a)] frequency
The X-axis represents the serum Lp(a) level, while the Y-axis represents the frequency.