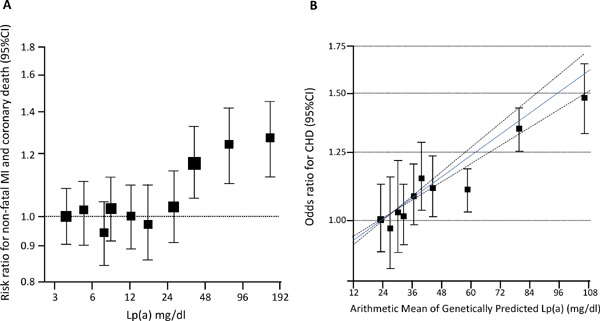
Fig. 3.

The evidence for lipoprotein [Lp(a)] as an independent and causal risk factor for atherosclerotic cardiovascular disease (ASCVD)
A, A meta-analysis of epidemiological studies, adjusted for usual levels of systolic blood pressure, smoking status, history of diabetes, body mass index, and total cholesterol. The X-axis represents the serum Lp(a) level, while the Y-axis represents the risk ratio for non-fatal MI and coronary death. B, the correlation between genetically predicted Lp(a) and CHD risk. The X-axis represents the serum Lp(a) level, while the Y-axis represents the odds ratio for the CHD risk. The blue solid line represents the best-fitting fractional polynomial to model the dose-dependent relationship; the dotted lines show the 95% confidence intervals for the relationship.
