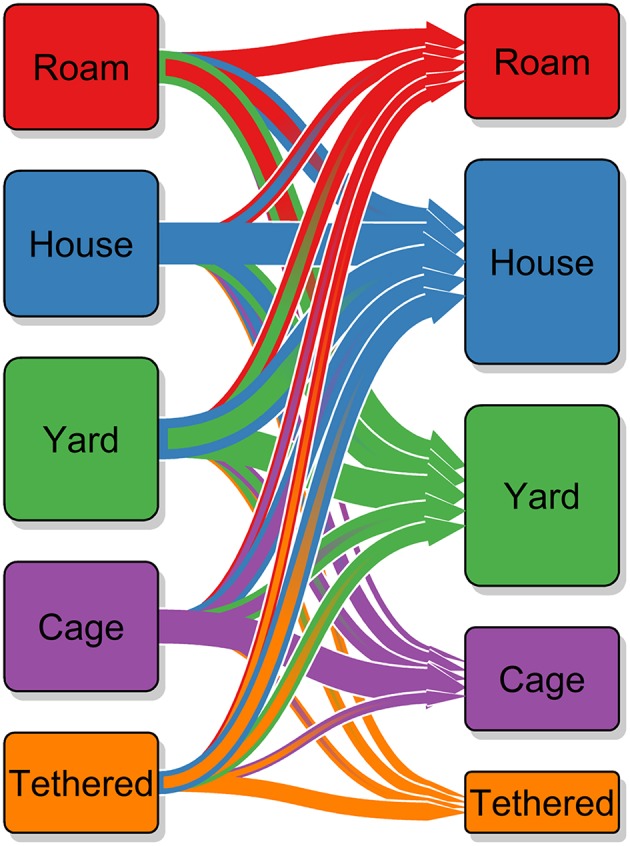
Figure 6.

Sankey diagram of transition in dog confinement method used by owners at baseline and at the most recent visit. The arrows show the direction from baseline to most recent visit, the size of the arrows and the size of the cuboid indicate the number of dogs involved; confinement at baseline is shown by the cuboids on the left and confinement at last revisit on the right. The outline color of the arrows also indicates which confinement method the arrow will end up at; the fact that nearly all the largest arrows have a blue outline indicates that a move to being confined to the house is the most common transition.
