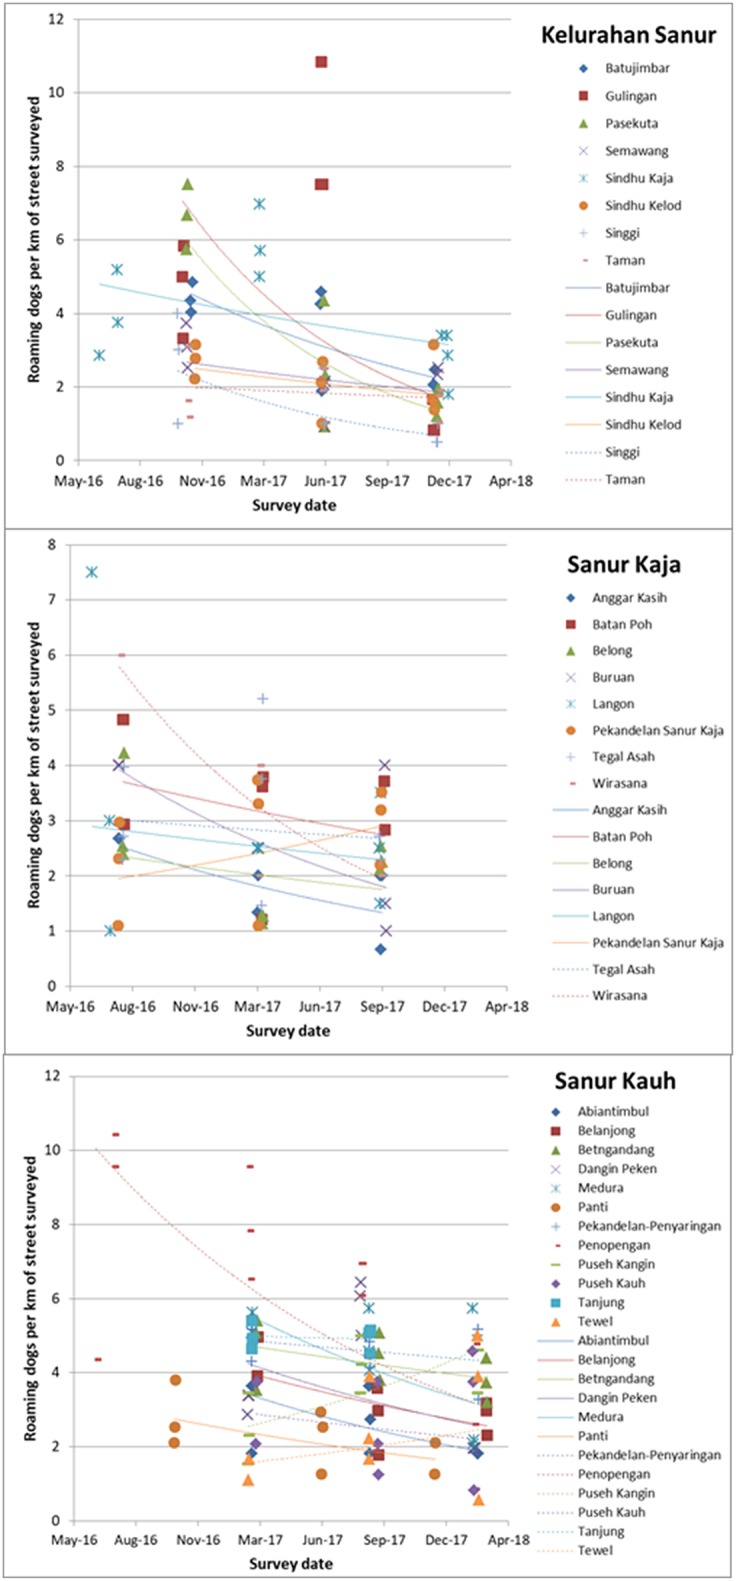
Figure 7.

(A–C) Change over time in the number of roaming dogs observed per km of street surveyed for each banjar within the three desas (Kelurahan Sanur, Sanur Kaja, Sanur Kauh). Colored icons represent roaming dog density on each of three replicate surveys along the same banjar survey route, across three street survey events every 6–8 months, with best fit exponential trendlines indicating the trend over time for each banjar.
