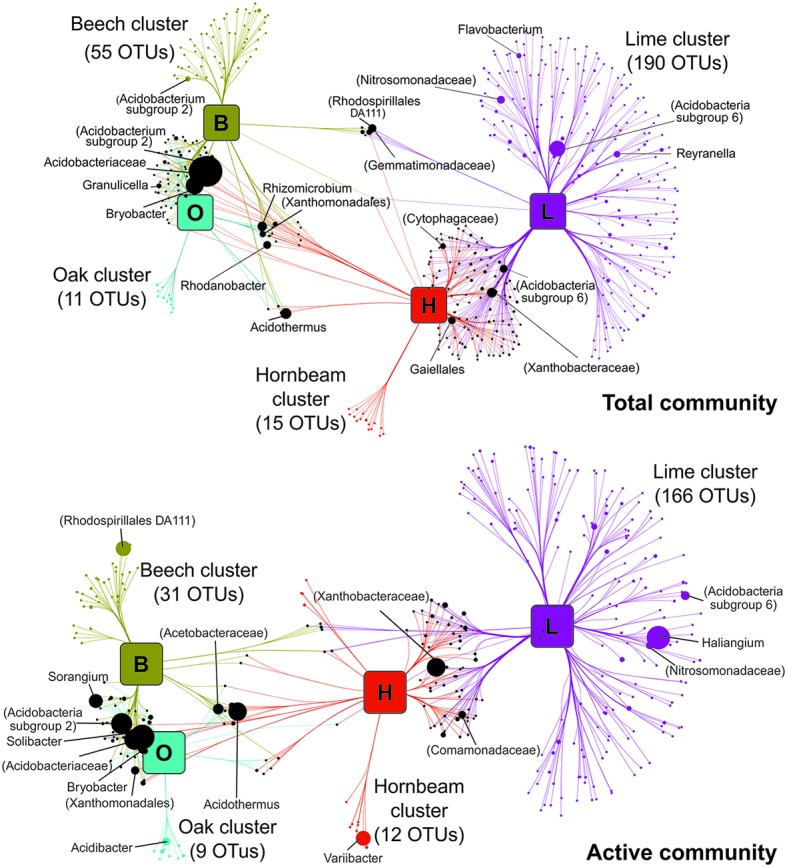
Figure 4.

Association networks between soil bacterial communities (genus level) and mono stands. Source nodes (rounded squares) represent mono species tree stands and edges represent associations between stands and bacterial OTUs (circles, target nodes). Edges are colored according to the source tree species and the length of edges is weighted according to association strength. Unique clusters, which associate with one tree species, consist of nodes colored as the corresponding stand. Numbers of OTUs making up respective unique clusters are given in brackets. Black circles represent OTUs with significant cross association between two or more plots. Target node sizes represent mean relative abundance of OTUs across all mono plots. Data only represents OTUs that showed significant positive association with tree species (p ≤ 0.05). In the case that the genus could not be assigned, the taxonomic name at the highest determined taxonomic resolution is given in parenthesis. For ease of visualization, edges were bundled together, with a stress value of 3. Abbreviations: beech (B), hornbeam (H), lime (L), oak (O), and operational taxonomic unit (OTU).
