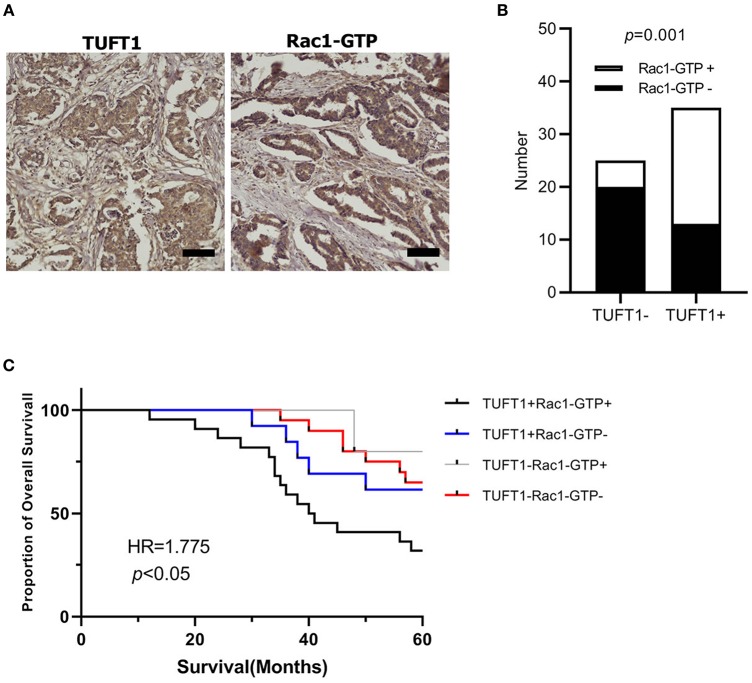
Figure 5.
The expression of TUFT1 and Rac1-GTP in 60 TNBC patients who had received anthracycline/taxanes chemotherapy after surgery. (A) Show the positive expression of TUFT1 and Rac1-GTP in serial sections. (B) Rac1-GTP positively correlated with TUFT1 expression in the TNBC samples. (C) Kaplan–Meier survival curves showing survival in 60 patients who received chemotherapy blotted in relation to TUFT1 and Rac1-GTP expression. Survival curves showing the poor overall survival in patients with tumors co-expressing TUFT1 and Rac1-GTP that received chemotherapy.

