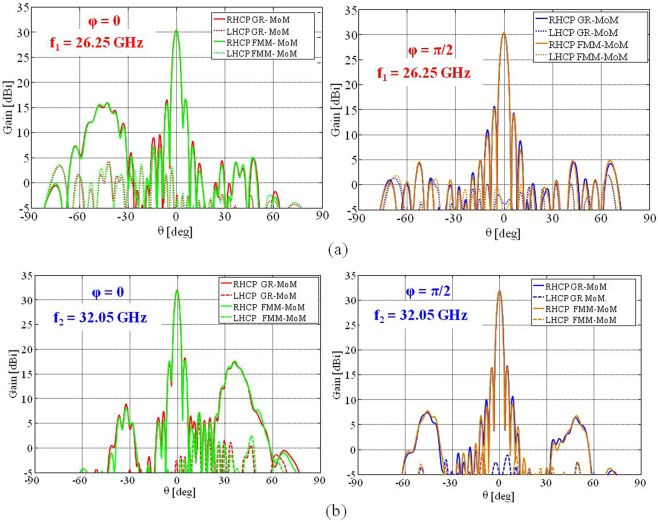
Figure 11.
Comparison between the directivity patterns obtained with the GR-basis MoM and the FMM approach that exploits entire domain basis functions for elliptical elements at (a) f = 26.25 GHz and (b) f = 32.05 GHz. The solid and dashed red and blue lines show the co-polar and cross-polar components, respectively, of the pattern evaluated by the impedance BC-MoM. The solid and dashed green and orange curves present the co-polar and cross-polar components of the radiation pattern, respectively, obtained by the FMM approach.

