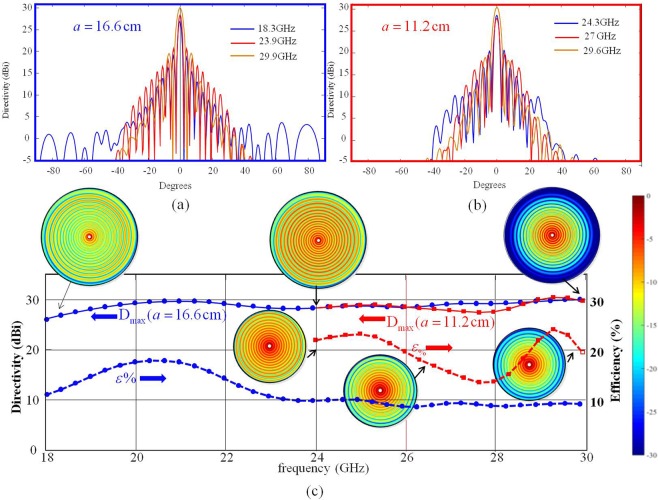
Figure 7.
Performances of the wideband MTS prototypes; (a) and (b) represent directivity patterns obtained with the “continuous impedance“ MoM model for the 16.66 cm radius antenna (a) and for a 11.11 cm radius antenna at different frequencies. (c) Maximum directivities (solid lines, left scale) and efficiency (dashed lines, left right scale) versus frequency of the two wideband antennas. The insets in (c) represent the surface current distribution for both antennas at the same frequency samples used in (a,b).

