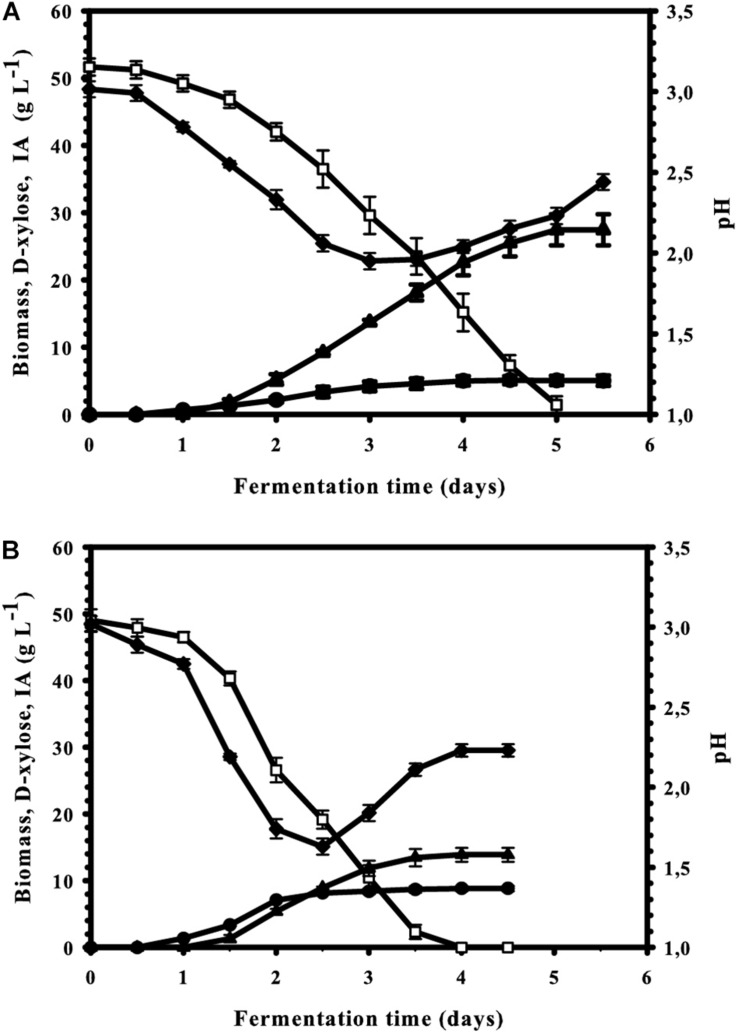
FIGURE 6.
Kinetics of biomass ( ), itaconic acid (▲), and residual D-xylose (
 ) concentrations as well as of the medium pH (◆) in controlled batch fermentations of A. terreus, performed in a 2-L scale bioreactor. The first three variables share the same y-axis as they are expressed in the same unit (g L– 1). (A) Mn2+ ion-limited culture (<3 μg L– 1]. (B) Culture supplemented with 0.1 mg L– 1 Mn2+ ions.

