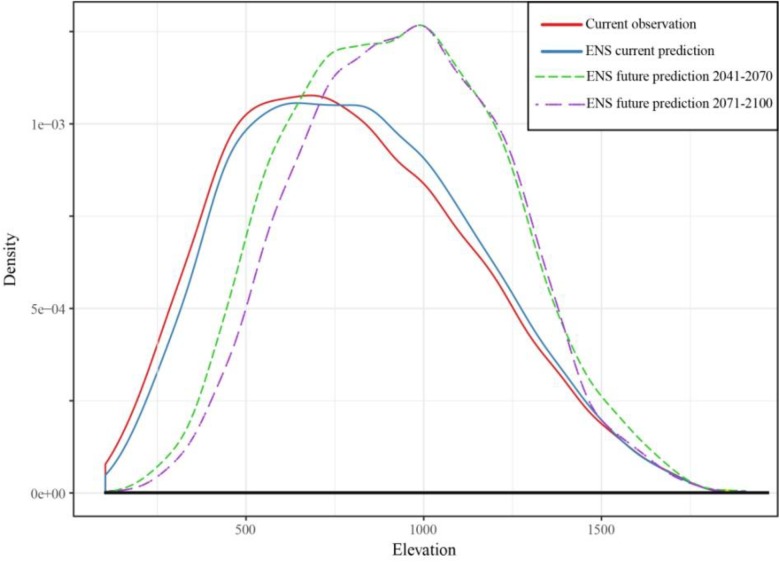
FIGURE 2.
Projections of SDMs for the distribution of European beech along the elevation gradient for the current climate (solid blue curve) and the climate predicted by the A2 scenario from 2041 to 2070 and from 2071 to 2100 (dashed curves). The solid red curve indicates the present observed distribution. Ensemble models (ENS) were used for the projections of beech distribution. Figure obtained in R package “ggplot2” (Wickham, 2016).

