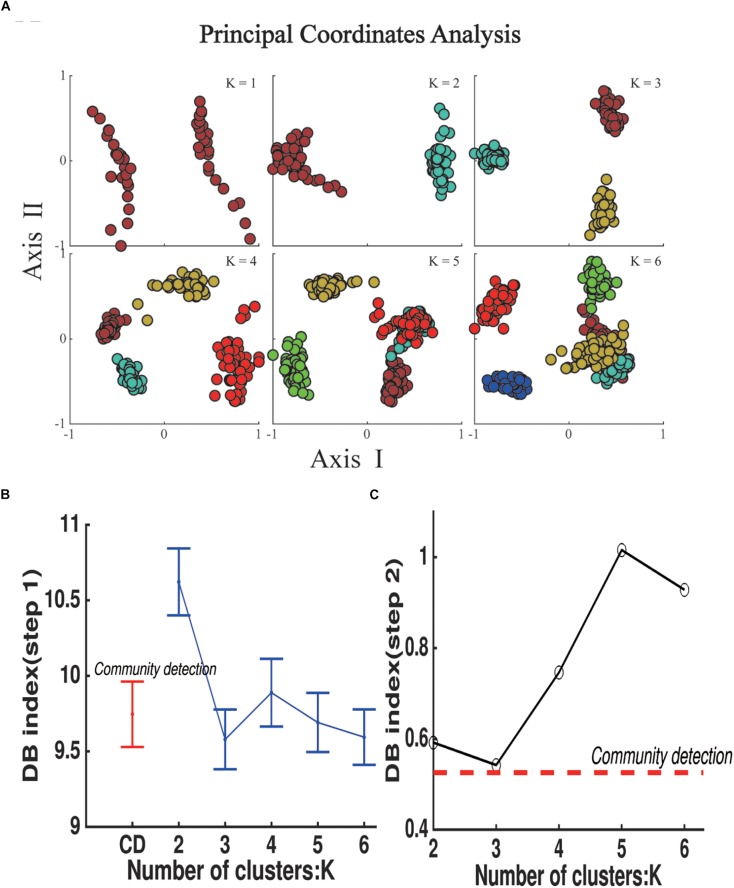
FIGURE 5.
State Detection results using k-means clustering algorithm in step 1. (A) The scatter plot of k means centroids obtained in step 1 in principal coordinate analysis, K represents the number of the clusters in each group and N represents the number of communities detected by Modularity-based algorithm in step 2. (B) DB index for the clustering results for groups in step 1. Dots represent the mean value for 48 groups and error bars represent standard deviation. (C) DB index for the clustering results of k means centroids (blue polygon) and community centroids (red dash line).

