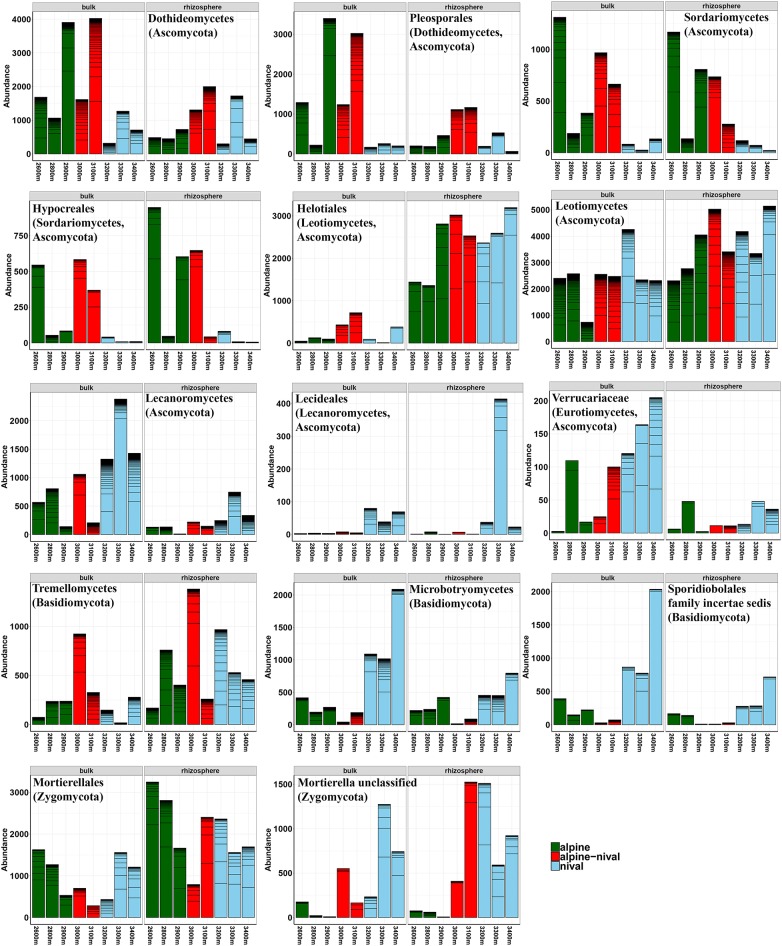
Figure 3.
Selected abundance histograms of fungal taxa that show significant changes according to the altitudinal gradient detected as biomarkers by LEfSe. Bars show absolute abundances (reads) of the selected taxa (n = 3). The abundances for OTUs within the selected taxa are stacked in order from greatest to least and are separated by thick, black stack lines. Elevations in the alpine zone (2,600–2,900 m) are indicated in green, alpine-nival zone (3,000–3,100 m) in red, and the nival zone (3,200–3,400 m) in blue. The left side of each single figure gives results derived from the bulk soils, the right side from the rhizosphere samples. The corresponding phylum, class or order of the selected taxon is given in parenthesis. Taxonomic groups are sorted alphabetically according to phylum and follow the appearance in the text.

