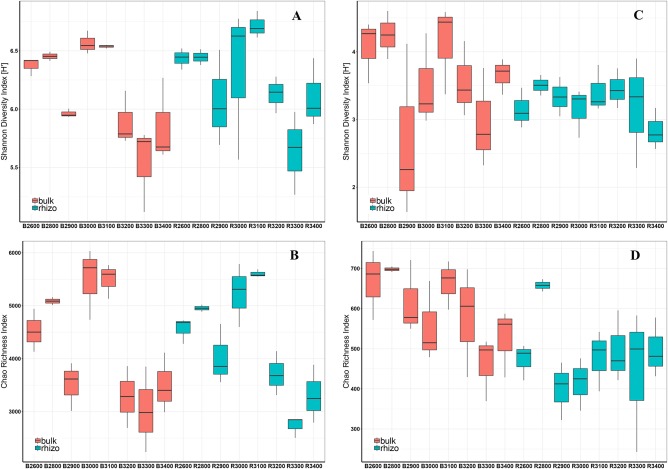
Figure 5.
Shannon–Wiener Diversity Index (H') (A) and Chao Richness Index (B) of prokaryotic communities and Shannon-Wiener Diversity Index (H') (C) and Chao Richness Index (D) of fungal communities in all bulk (red) and rhizosphere (blue) soils along the altitudinal gradient. X-axis: B, bulk soils; R, rhizosphere soils. Numbers indicate the respective altitude (2,600–3,400 m) (e.g., B2600 = bulk soils at 2,600 m a.s.l.). Boxes represent 25–75% of values, black lines medians (n = 3), and whiskers 1.5 interquartile ranges.

