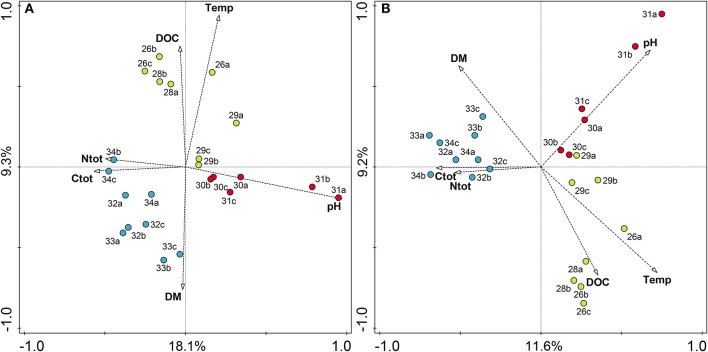
Figure 6.
Redundancy analysis (RDA) biplot showing the relationship between environmental variables and prokaryotic (A) and fungal (B) communities along the altitudinal gradient color-coded by altitudinal zone. Elevations in the alpine zone (2,600–2,900 m) are indicated in green, alpine-nival zone (3,000–3,100 m) in red, and the nival zone (3,200–3,400 m) in blue. Percentage values on axes represent percentage variation of species-environmental relation explained by consecutive axes. Numbers represent the respective altitudes, and letters indicate the replicates (e.g., 26a stands for the community at 2,600 m and replicate 1). Temp, annual mean temperature; DM, dry matter content; Ctot, total carbon; Ntot, total nitrogen; and DOC, dissolved organic carbon.

