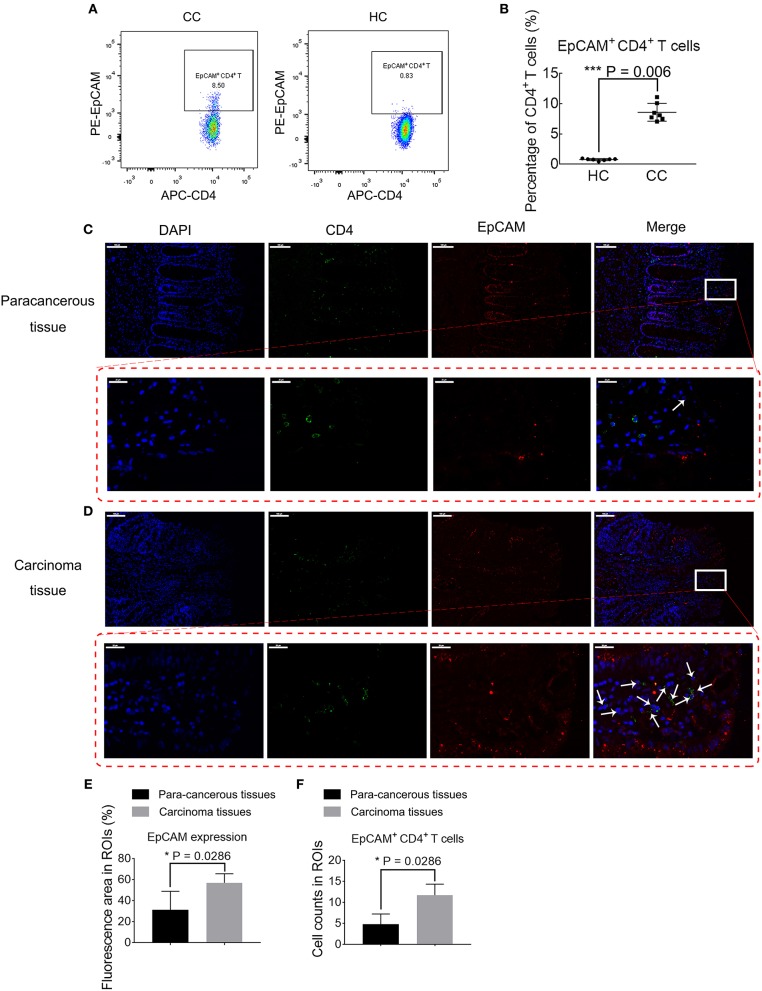
Figure 4.
Validation of disparity in percentages of EpCAM+ CD4+ T cells. (A) Biaxial plots comparing percentages of EpCAM+ CD4+ T cells in colon cancer patients (CC) and healthy controls (HC). (B) Percentages of EpCAM+ CD4+ T cell subsets in PBMCs in CC and HC. The data is illustrated as the mean ± SD. (C,D) Immunofluorescence staining of para-cancerous (C) or carcinoma tissues (D) from CC. Data is representative result of four experiments. Scale bar = 100 μm. Lower panel in red dotted box represent magnified views of arrow-marked EpCAM+ CD4+ T cells in para-cancerous (C) or carcinoma tissues (D). Scale bar = 20 μm. (E) Bar plot comparing the EpCAM expression area in carcinoma tissues and para-cancerous tissues. N = 4 for each group. Data is expressed as mean ± SD. (F) Bar plot depicting the differences in EpCAM+ CD4+ T cell abundance in carcinoma tissues and para-cancerous tissues. N = 4 for each group. Data is expressed as mean ± SD. Statistically significant differences are annotated with asterisk (*) and P (p-value) or ns, not significant. *P < 0.05, **P < 0.01, ***P < 0.001.

