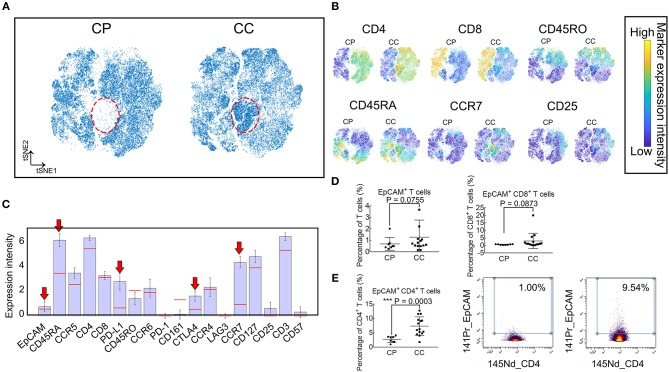
Figure 5.
Frequency of EpCAM+ CD4+ T cells were elevated in PBMC of patients with CC, but not CP. (A) Synthetic t-SNE maps depicting T cell subsets in colonic polyp (CP, N = 8) and colon cancer (CC, N = 15) patient groups. Suspect populations that compose almost entirely of cells from CC patients are marked in the red dotted ellipse region. (B) viSNE maps of T cells in CP and CC illustrating the expression of CD4, CD8, CD45RA, CD45RO, CCR7, and CD25. Color coding indicates the signified marker expression intensity. (C) Expression signatures of the identified subpopulations in (A). Bar height indicates the median expression of each marker within a subpopulation. The horizontal line for each marker corresponds to its median expression across all cells. Red arrow indicates three positive immune blockade marker expression. (D) Comparison of percentages in T cells of EpCAM+ and EpCAM+ CD8+ T cells between CP and CC. Error bar indicates standard deviation (SD). (E) Comparison of percentages of EpCAM+ CD4+ T cells in CD4+ T cells between CP and CC (left panel). Biaxial plots showing higher frequency of EpCAM+ CD4+ T cells in CC than in CP (right panel). Statistically significant differences are annotated with asterisk (*) and P (p-value) or ns, not significant. *P < 0.05, **P < 0.01, ***P < 0.001.

