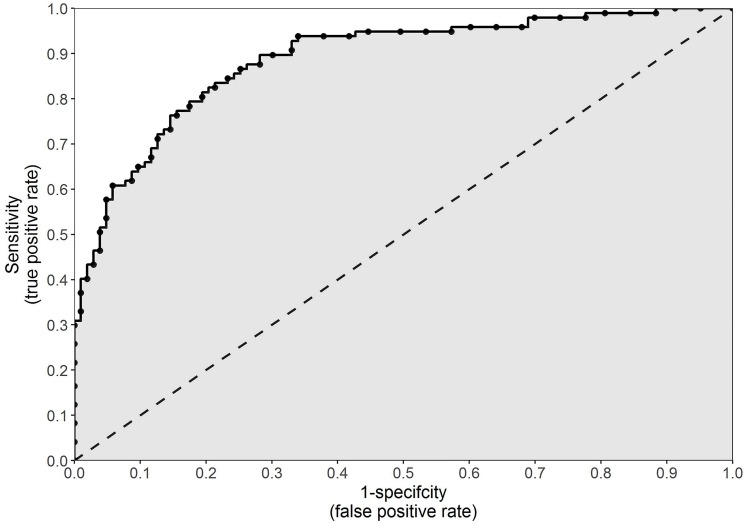
FIGURE 3.
An example of a receiver operating characteristic curve, which can be used to illustrate how well a continuous variable performs as a binary classifier. The true positive rate (sensitivity) is plotted against the false positive rate (1 – specificity) at every conceivable cut point for a continuous variable. The gray shaded area indicates the area under the curve.

