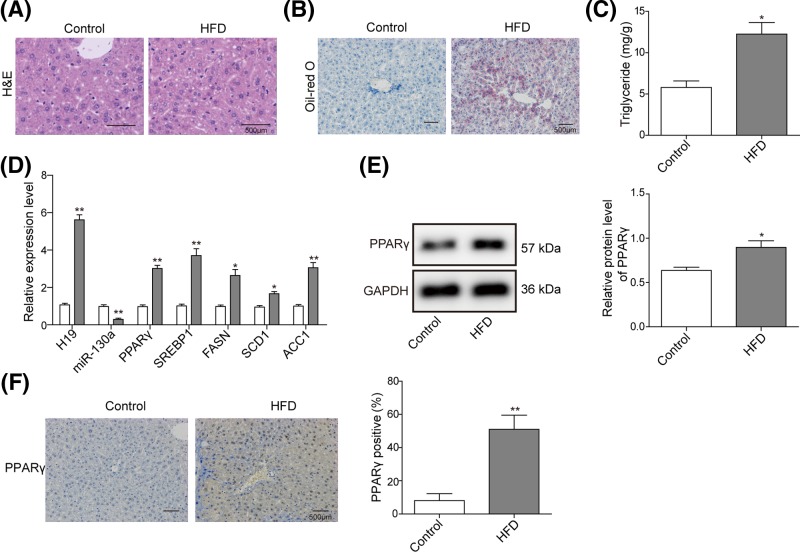
Figure 1. The expression level of H19 and hepatic lipogenesisis in NAFLD mouse model.
(A) H&E staining showed general tissue morphology of mouse livers between control and HFD groups. (B) Oil-Red O staining showed prominent lipid deposition in HFD mice. (C) TG levels were assessed by ELISA assay in liver tissues. (D) qRT-PCR was used to detect the level of H19, miR-130a and molecular marker of NAFLD (PPARγ, ACC1, SCD1, FASN and SREBP1) in NAFLD mouse liver tissues. β-actin or U6 were used for normalization. (E) Western blot analysis of PPARγ level in NAFLD mouse liver tissues. GAPDH was used for normalization. (F) IHC detection of PPARγ in NAFLD mouse liver tissues. All the results were shown as mean ± SD (n=3), which were three separate experiments performed in triplicate. *P<0.05 and **P<0.01.

