
Figure 2.
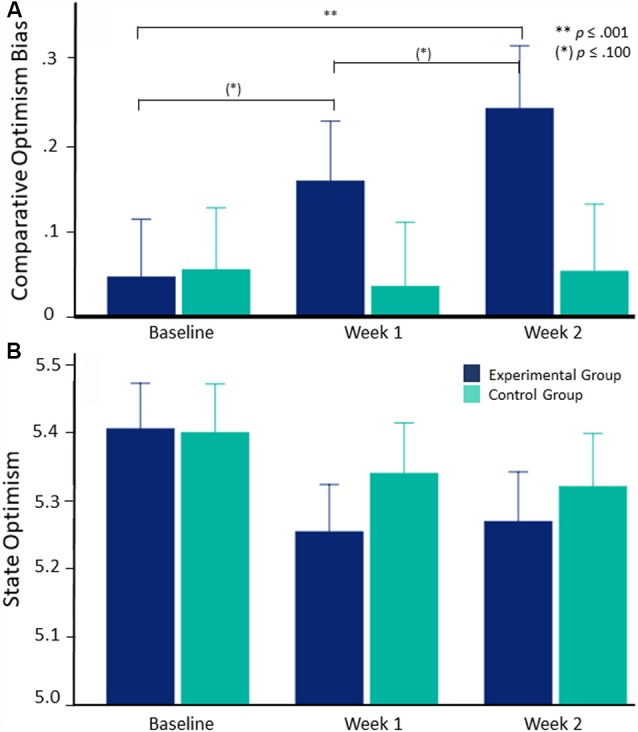
Change in comparative optimism bias and state optimism from baseline to after two training weeks in the experimental/control group. Error bars depict standard errors. (A) Comparative optimism bias significantly increases over the 2-week training period in the experimental group but does not change in the control group when we control for trait optimism. (B) State optimism does not differ between groups or change over time when we control for trait optimism.