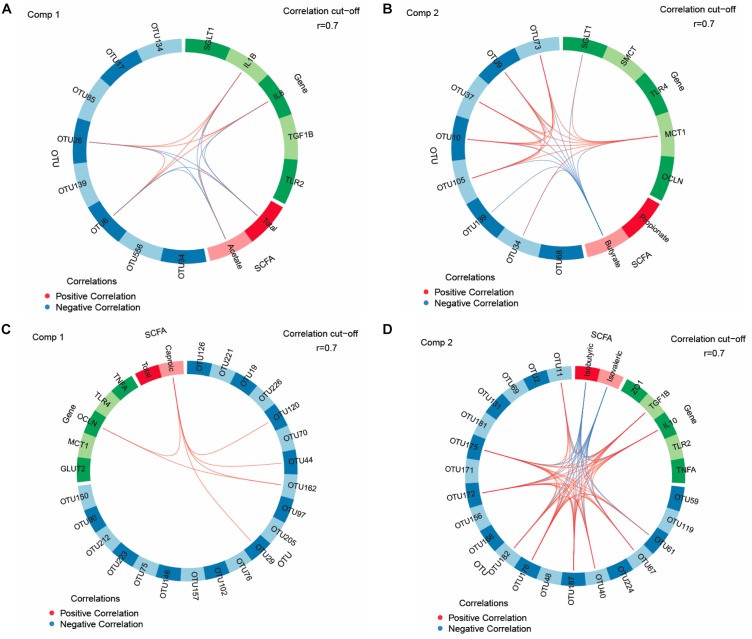
FIGURE 1.
Circos plots of horizontal sparse partial least squares-discriminant analysis displaying correlations between the identified best discriminant operational taxonomic units (OTUs), short-chain fatty acids (SCFA, n = 5) and expression levels of target genes for component 1 and component 2 in the jejunum and ceca. Correlations for component 1 (comp) 1 (A) and 2 (B) in jejunum (OTUs, n = 8; SCFA, n = 2; genes, n = 5). Correlations for comp 1 (C) and 2 (D) in ceca (OTUs, n = 20; SCFA, n = 2; genes, n = 5). Positive and negative correlations (| r| > 0.7) are displayed by red and blue links, respectively. Relative abundance of bacterial OTUs > 0.01% of all reads. GLUT2, glucose transporter 2; IL, interleukin; MCT1, monocarboxylate transporter 1; OCLN, occludin; SGLT1, sodium-dependent glucose transporter 1; SMCT, sodium/monocarboxylate transporter; TGF1B, transforming growth factor beta-1; TLR, toll-like receptor; TNFA, tumor-necrosis factor alpha; ZO1, zonula occludens. The taxonomic identification of the most influential OTUs can be found in Supplementary Table S8.

