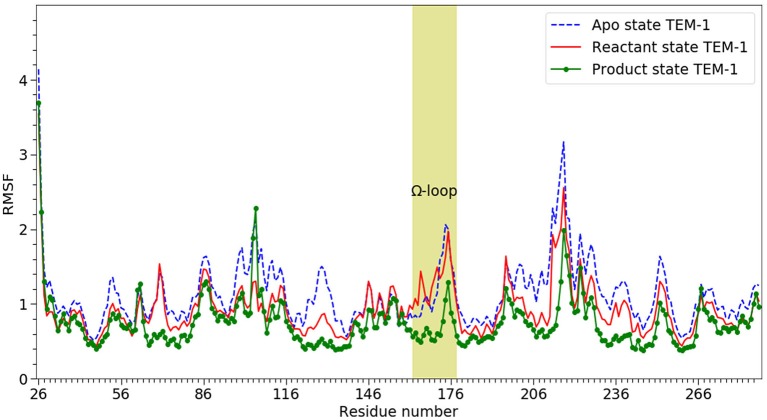
Figure 3.
The RMSF of α-carbons (Cα) from 26 to 288 on TEM-1 β-lactamase in apo (blue dash line), reactant (red line) and product states (dot line), Ω loop (residue 163–180) highlighted. All three states have overall similar distribution but with significant difference. The product shows the lowest overall RMSF. The apo state show the highest overall RMSF.

