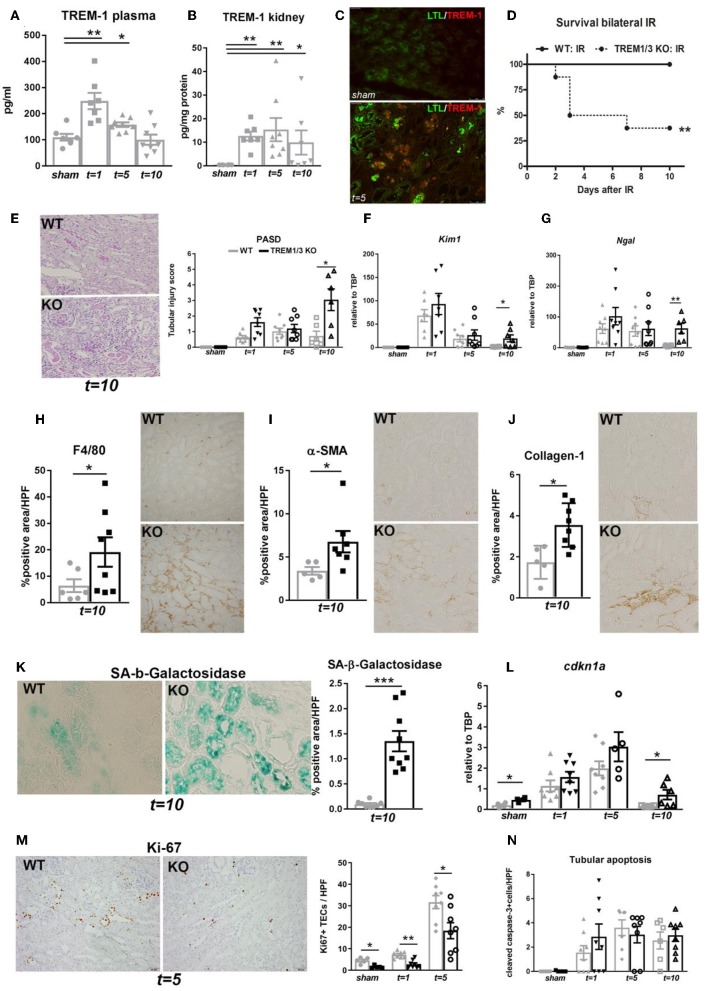
Figure 1.
TREM-1 limits the maladaptive repair following renal IR injury. (A) Plasma TREM-1 concentration and (B) TREM-1 protein levels in kidney lysates from sham-operated mice and WT mice subjected to bilateral IR (25 min clamping) and sacrificed at day 1, 5, and 10 post-surgery. (C) Representative pictures of immunofluorescence staining on kidney tissue from WT mice in sham-operated conditions and 5 days post-IR, with TREM-1 (red) and lotus tetragonolobus lectin (LTL: proximal tubule marker) in green. (D) Survival graph of WT and TREM1/3 KO mice subjected to bilateral IR for 25 min (= severe AKI). (E) Quantification of tubular injury obtained by histopathological scoring of PAS-D-stained, paraffin-embedded, renal sections from WT and TREM1/3 KO animals sacrificed at day 1, 5, and 10 post-unilateral IR (= mild AKI). Representative pictures of WT and TREM1/3 KO animals at day 10 post-IR. (F,G) Renal expression of tubular injury markers Kim1 and Ngal measured by RT-PCR in tissue isolated from sham WT, WT and TREM1/3 KO mice sacrificed 1, 5, and 10 days post-IR. (H) Quantification of immunohistochemical staining and representative pictures for macrophages (F4/80), (I) myofibroblasts (α-SMA) and (J) collagen type-1 deposits in WT and TREM1/3 KO mice 10 days post-surgery (magnification 40X). (K) Quantification and representative pictures of SA-β-Gal staining in WT and TREM1/3 KO mice 10 days post-surgery (magnification 40X). (L) Transcript expression of renal cdkn1a (p21) in WT and KO mice in sham conditions and post-IR. (M) Quantification of TECs proliferation detected by Ki67 immunohistochemical staining in WT and TREM1/3 KO mice in sham conditions and 1 and 5 days post-surgery. Representative pictures of WT and TREM1/3 KO kidneys at day 5 (magnification 20X). (N) Quantification of tubular apoptosis detected by cleaved-caspase-3 immunohistochemical staining in WT and TREM1/3 KO mice in sham conditions and post-IR. Data are expressed as mean ± SEM. (A,B) Kruskal–Wallis and Dunn's multiple comparison test, (D) Log-rank (Mantel-Cox) test. (E–N) One way Anova followed by Mann–Whitney test were used to determine statistical differences. *P < 0.05, **P < 0.01, ***P < 0.001.

