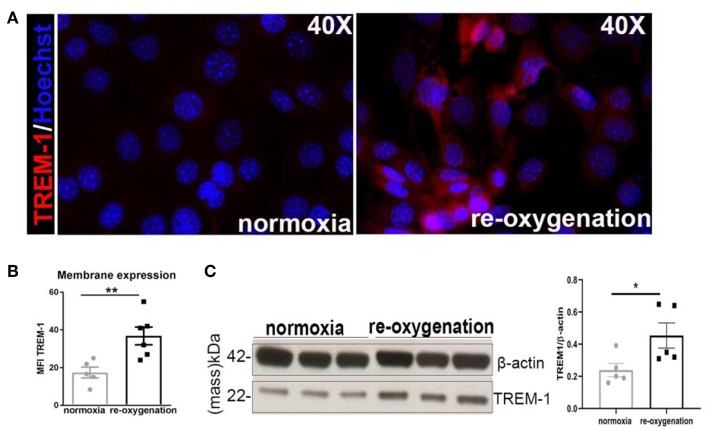
Figure 2.
TREM-1 is expressed in TECs upon hypoxia-reoxygenation (A). Representative immunofluorescent images of IM-TECs cultured on coverslips in normoxia conditions and after hypoxia-reoxygenation. Cells were stained with TREM-1 (Alexa 594, red) and Hoechst (nuclei). (B) Mean Fluorescence intensity (MFI) of TREM-1 membrane expression measured by flow cytometry. (C) Protein lysates of the same experiment blotted for anti-TREM-1 Ab and β-actin. In (B,C) data are expressed as mean ± SEM and the unpaired t-test was used to determine statistical differences. N = 5–6 animals/group. *P < 0.05, **P < 0.01.

