Figure 3.
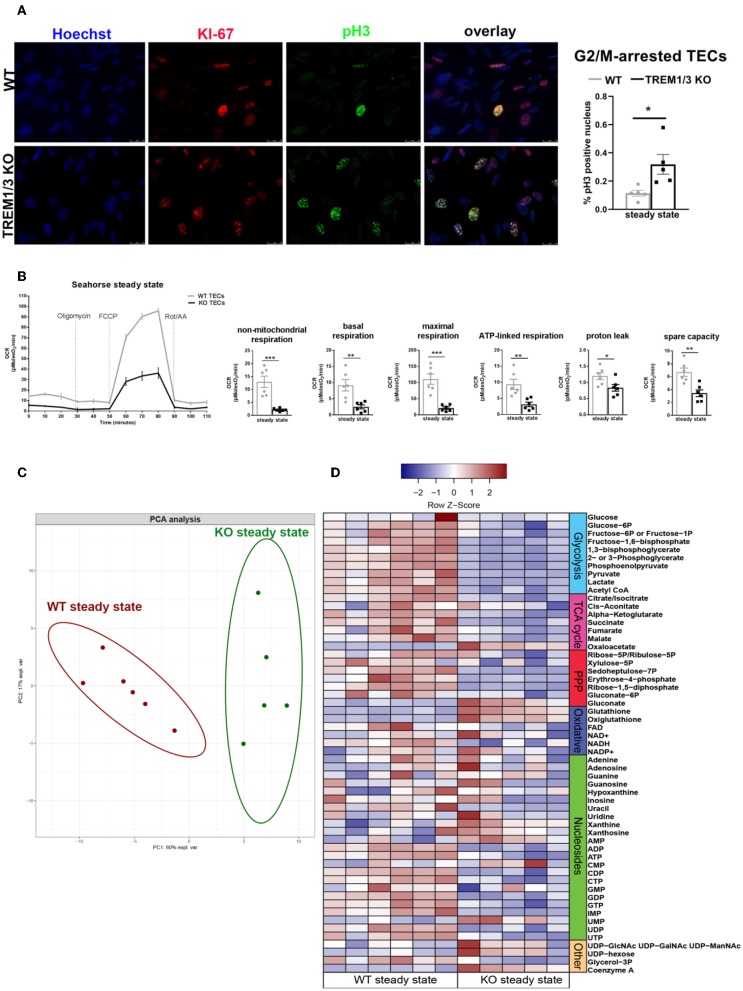
TREM1/3 KO primary TECs display arrest in G2/M and reduced mitochondrial metabolism at steady state. (A) Representative immunofluorescent images of primary TECs at steady state isolated from WT and TREM1/3 KO animals (n = 5) (magnification 40X). Cells were stained with Hoechst (nuclei), anti-Ki67 (proliferating cells), Alexa 594 and anti-phosphorylated histone H3(ser10)- Alexa 488-conjugated (to identify cells in G2/M). Quantification of percentage of phosphorylated histone H3 positive nuclei per HPF. (B) Seahorse Bioanalyzer OCR readout of a typical mitochondrial function assay using WT and TREM1/3 KO primary TECs without adjustment for cell number. AA, antimycin A; rot, rotenone. Conditions were measured in triplicate. The bar graphs represent data adjusted for cell input for WT and TREM1/3 KO primary TECs. (C) Principal component analysis (PCA) of intracellular metabolite levels from WT and TREM-1/3 KO primary TECs at steady state (CTR) as determined by LC-MS (metabolomics) (n = 5/6 mice per group). (D) Differences in metabolic pathways are displayed by the heatmap. (A,B) All data are expressed as mean ± SEM and the unpaired t-test was used to determine statistical differences. *P > 0.05, **P < 0.01, ***P < 0.001.

