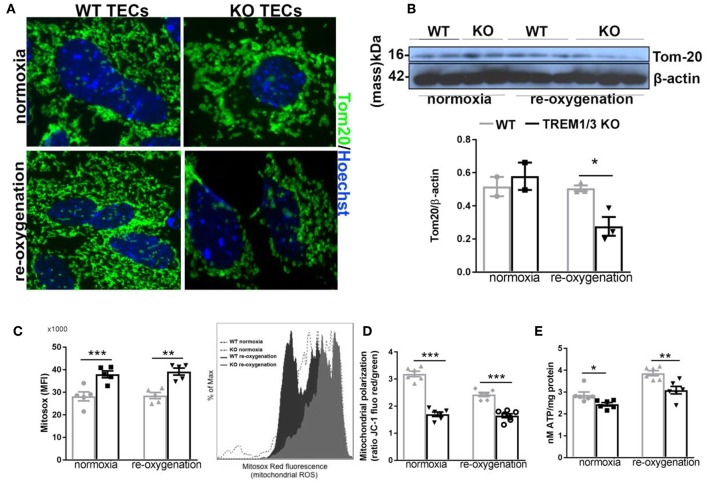
Figure 4.
TREM1/3 deficient TECs display an altered mitochondrial homeostasis. (A) Representative immunofluorescent images of primary TECs stained for mitochondrial protein TOM20 (Alexa488) and Hoechst (nuclear staining), under normoxic conditions and 24 h after re-oxygenation (magnification 100X) (N = 3 animals per conditions). (B) Western blot of WT and TREM1/3 KO primary TECs blotted for TOM20 and β-actin. (C) Mitochondrial ROS production measured by FACS analysis with MitoSox probe. Histogram representation of Mitosox events expressed as % of max. (N = 5 animals per group). (D) Mitochondrial polarization measured by cationic dual-emission fluorescent probe, expressed as a ratio between red (mitochondria, J-aggregates) and green (cytoplasm, dye monomers) fluorescence intensity. Results are expressed as a ratio of red and green fluorescence emission. (N = 5 animals per group). (E) ATP production in protein lysates of WT and TREM1/3 KO primary TECs, corrected for the total protein concentration measured by BCA (N = 5/6 animals per group). All data are expressed as mean ± SEM and the unpaired t-test was used to determine statistical differences. *P < 0.05, **P < 0.01, ***P < 0.001.

