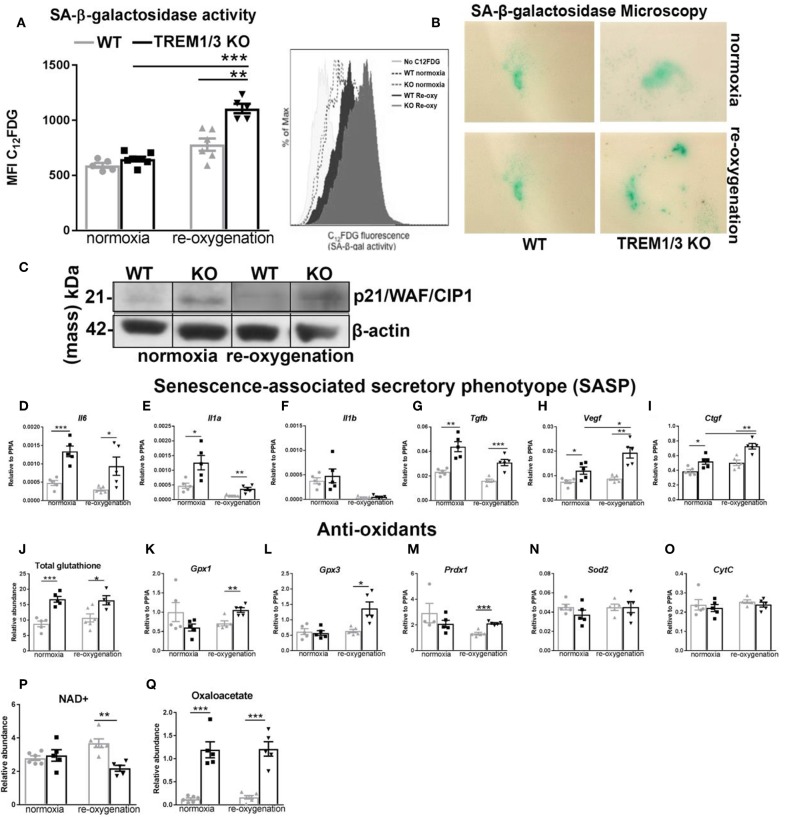
Figure 5.
TREM1/3 KO TECs display senescence upon hypoxia-derived oxidative stress. (A) FACS analysis of senescence- associated β-galactosidase (SA-βgal) assay by C12FDG incorporation in WT and TREM1/3 KO primary TECs in normoxia conditions and upon hypoxia/re-oxygenation (N = 5/6). (B) (SA-βgal) staining obtained in primary WT and TREM1/3 KO TECs in normoxia and hypoxia/re-oxygenation, cultured on coverslips. Blue/green cells represent senescent cells. (C) p21 protein expression shown by western blot in primary TEC lysates isolated from WT and TREM1/3 KO animals during normoxia and hypoxia-reoxygenation. (D–F) Transcript expression of SASP-components such as pro-inflammatory (Il6, Il1a, Il1b) and (G–I) profibrotic genes (Tgfb, Vegf, and Ctgf) in WT and TREM1/3 KO primary TECs under normoxia/re-oxygenation conditions (N = 5). (J–O) Anti-oxidant expression, such as total glutathione, measured by metabolomics, and transcript expression of glutathione peroxidase 1-2 (gpx1 and gpx3), peroxiredoxin 1 (prdx1), and cytochrome C (CytC), measured by RT-PCR in WT and KO TECs in normoxia/re-oxygenation conditions (N = 5). (P,Q) Total NAD+ and oxaloacetate levels measured by metabolomics. All data are expressed as mean ± SEM and the unpaired t-test was used to determine statistical differences. *P < 0.05, **P < 0.01, ***P < 0.001.

