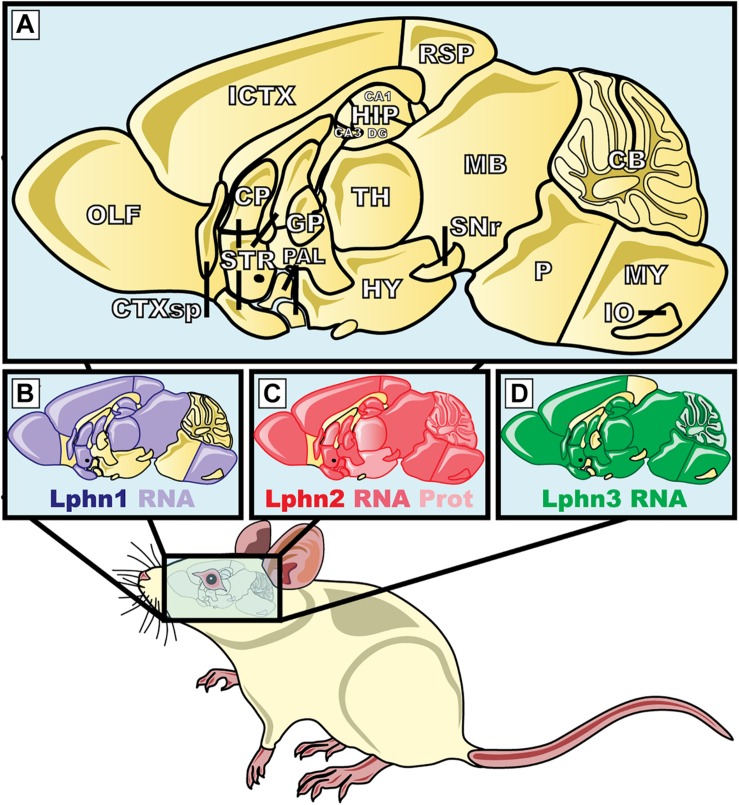
FIGURE 7.
Expression pattern of the three isoforms of latrophilins in the central nervous system of Mus musculus. (A) The magnification represents the mid-sagittal section of the brain of M. musculus; (B–D) areas highlighted in purple, red and green show the latrophilin-1, 2, and 3 mRNA or protein expression, respectively. ICTX, Isocortex; HIP, hippocampus; CA, Ammon′s horn; DG, dentate gyrus; HY, hyppothalamus; CP, caudate puntamen; TH, thalamus; IO, inferior olivary; STR, striatum; SNr, substantia nigra pars reticulata; GP, globus pallidus; RSP, retrosplenial cortex; CB, cerebellum, CTXsp, cortical subplate; MB, midbrain; MY, medula; OLF, olfatory areas; PAL, pallidum; P, pons. Protein data were from Anderson et al. (2017). mRNA data were extracted from Kreienkamp et al. (2000), Tobaben et al. (2000) and the Allen Brain Atlas (www.brain-map.org).

