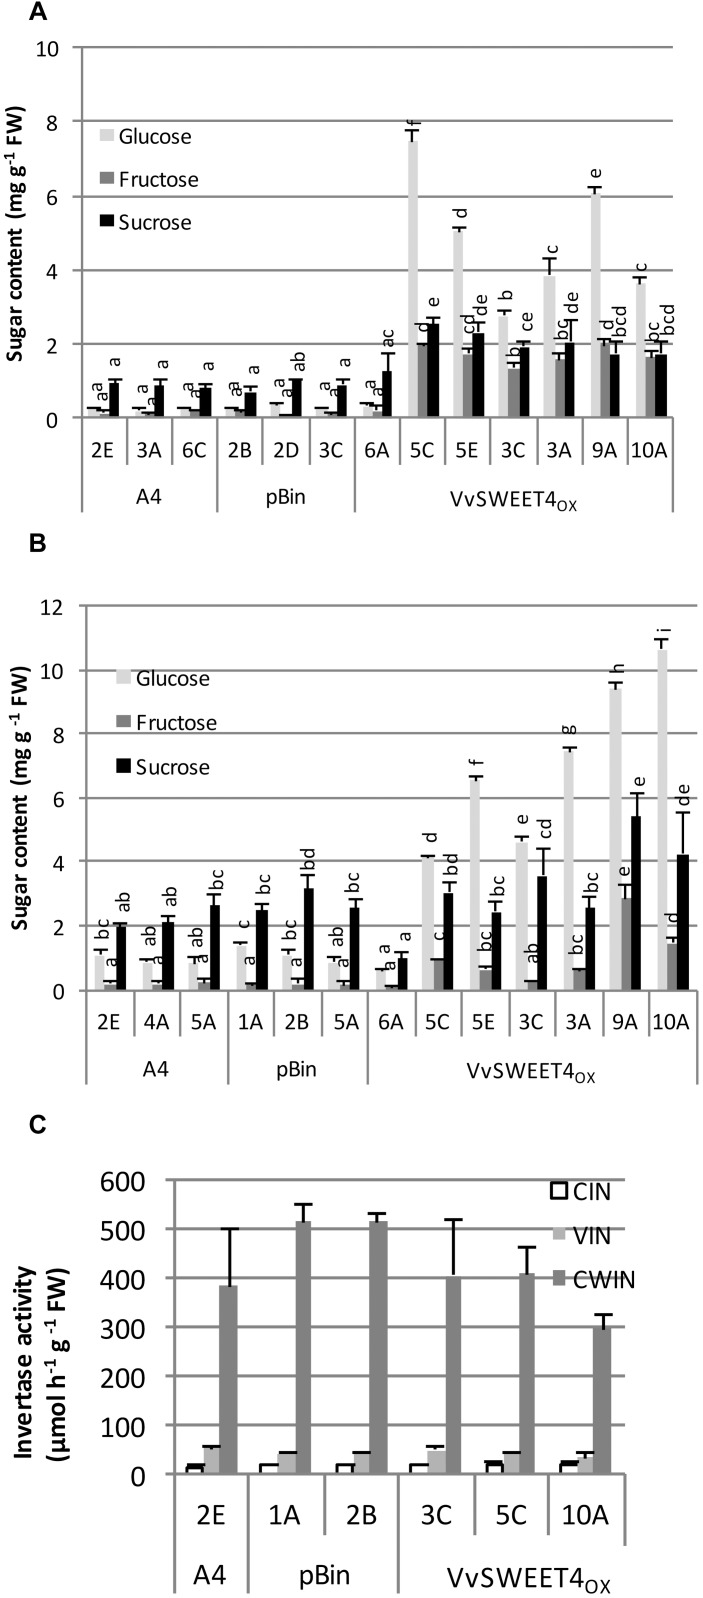
FIGURE 3.
Sugar contents and invertase activities of hairy root lines. Levels of glucose, fructose and sucrose were measured in hairy root tips 2 weeks after subculture on sucrose (A) or glucose (B) containing medium. Data are the mean ± SD of 4 independent experiments. Means with different letters are significantly different at p ≤ 0.05 (Tukey Contrasts). (C) Cytoplasmic (CIN) vacuolar (VIN), and cell wall (CWIN) invertase activities. Data are the mean ± SD of three technical replicates. A second biological replicate with another set of lines produced similar results (Supplementary Figure S1). The different letters correspond to the different groups after the statistic Tukey Test (precized in the figure legend).

