. 2019 Jul 15;3(2):E48–E57. doi: 10.1055/a-0900-7501
This is an open-access article distributed under the terms of the Creative Commons Attribution-NonCommercial-NoDerivatives License, which permits unrestricted reproduction and distribution, for non-commercial purposes only; and use and reproduction, but not distribution, of adapted material for non-commercial purposes only, provided the original work is properly cited.
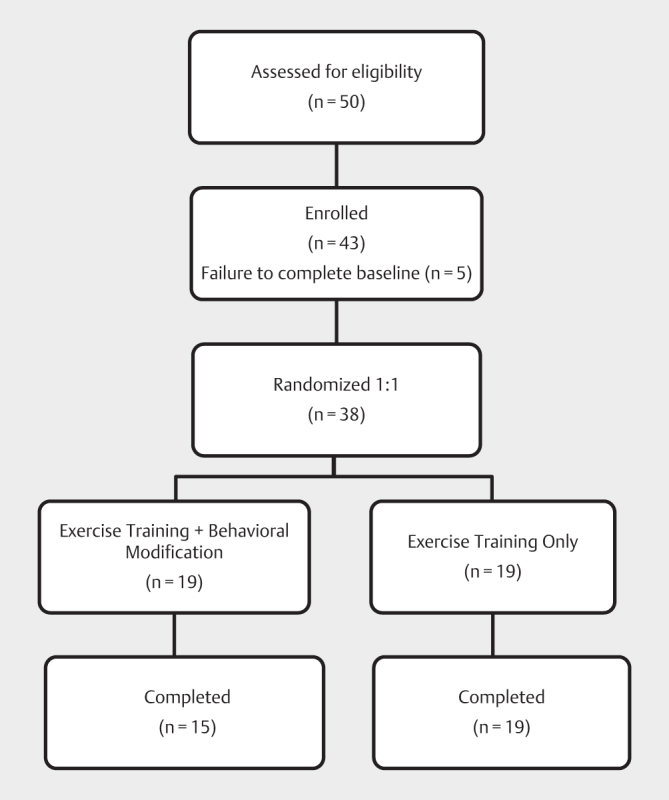
Fig. 1.

CONSORT diagram showing participant flow through the study.
