
Figure 3.
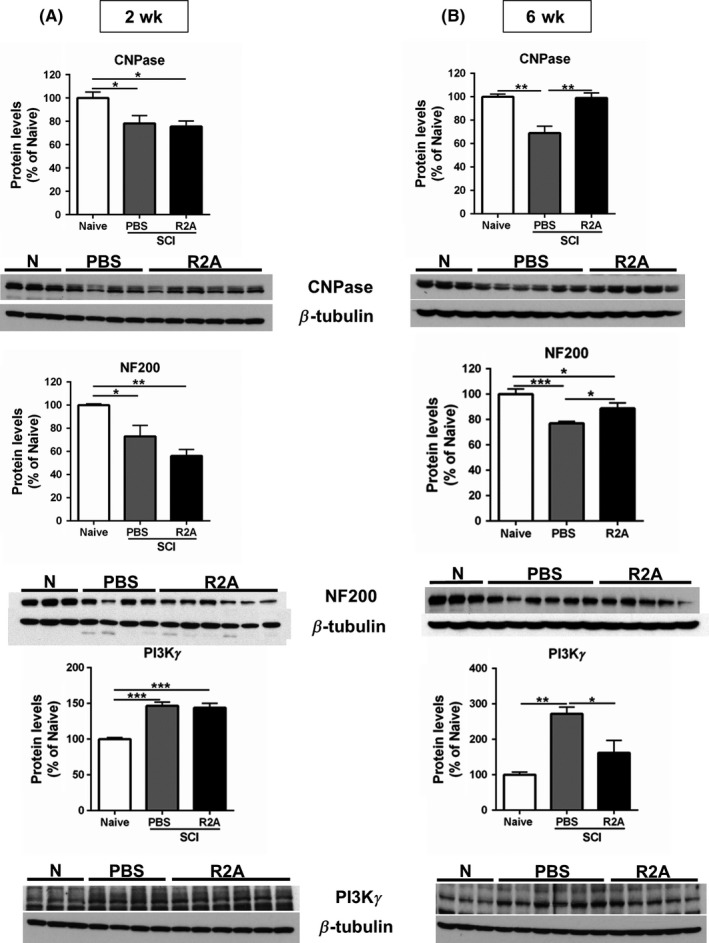
Expression levels of proteins around the lesion site following spinal cord injury. A, Expression of CNPase, neurofilament H (NF200), and PI3Kγ 2 weeks following injury. Bar graphs represent the mean ± SEM of n = 3 naïve (N), n = 4 PBS, and n = 6 R2A. ***P < 0.001; **P < 0.01; *P < 0.05. B, CNPase, NF200, and PI3Kγ protein expression, 6 weeks following injury. Last sample in the NF200 blot was an outlier as determined by the Grubb's method and was excluded from the bar graph. Bar graphs represent the mean ± SEM of n = 3 naïve, n = 6 PBS, and n = 5 R2A ***P < 0.001; **P < 0.01; *P < 0.05. PBS: spinal cord injured controls infused with PBS; R2A: spinal cord injured animals infused with EHD2‐sc‐mTNFR2