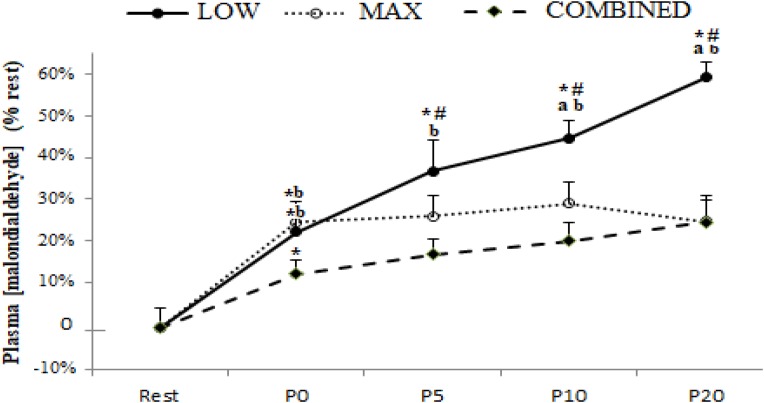
FIGURE 1.
Plasma malondialdehyde concentration before (Rest), immediately after (P0), and 5 (P5), 10 (P10) and 20 (P20) minutes after maximal-intensity, low-intensity and maximal- and low-intensity exercise combined. Data are expressed as the % change from pre-exercise resting concentrations. LOW: low-intensity exercise; MAX: maximum-intensity exercise; COMBINED: combined maximum-intensity and low-intensity exercise; ∗: significant difference compared to pre-test values; # significant difference compered to P0, a: significant difference compared to the MAX exercise;b: significant difference compared to the COMBINED exercise.

