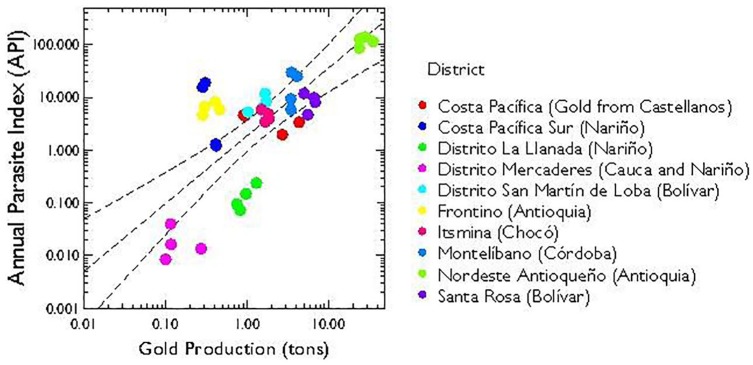
Figure 7.
Correlation between the annual parasite index (API, cases per 1000 inhabitants) for malaria and the annual gold production (tons) for the highest producing districts of Colombia (Pearson R = 0.75, P < .0001). Each point represents data for a single year between 2010 and 2013. The center dashed line is the linear regression and the outer dashed lines are 95% confidence limits. Our figure separates the pooled data for Costa Pacífica (shown in Castellanos et al53) into the 3 Nariño districts and Istmina in Chocó.

