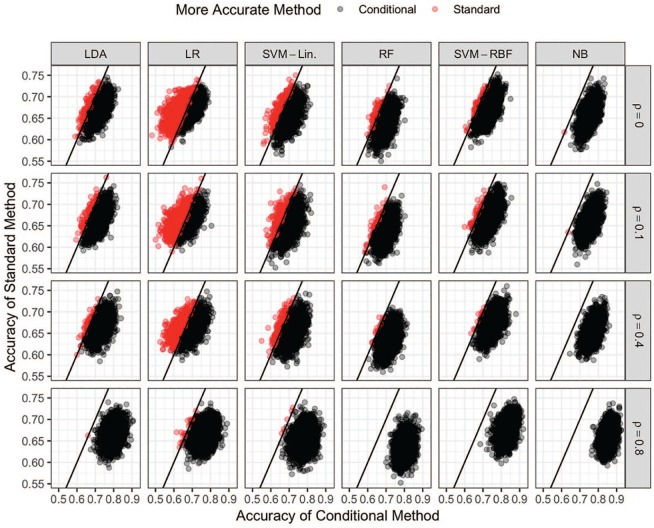
Figure 2.
Scatter plots of the classification accuracies for all conditional (x-axis) and standard (y-axis) methods and values of when . The color of each point indicates which version, standard (red) or conditional (black), of each method is more accurate for each simulated dataset. LDA indicates linear discriminant analysis; LR, logistic regression; NB, Naive Bayes; RBF, radial basis function; RF, random forests; SVM, support vector machine.

