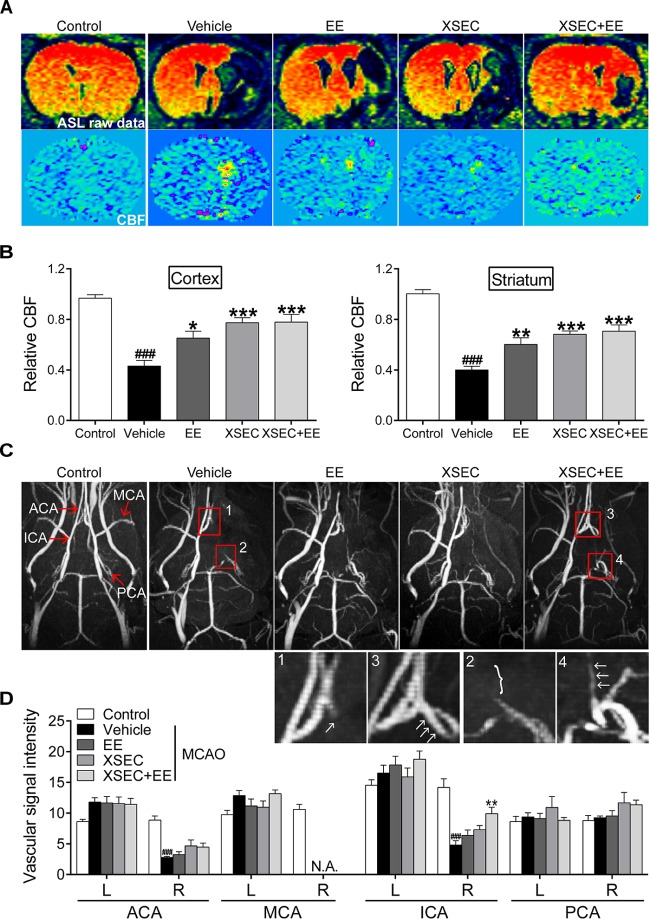
FIGURE 2.
Effect of combination treatment with XSEC and EE on cerebral perfusion in MCAO rats. (A) Representative ASL raw data maps and CBF maps were obtained from various groups. (B) The analysis of result of the relative CBF in the ipsilateral cortex and striatum. (C) Representative axial MIP maps of MRA were obtained from various groups. The amplified ACA (1, 3) and ICA (2, 4) signal pictures were below. (D) Quantitative analysis of vascular signal intensity. ACA, anterior cerebral artery; MCA, middle cerebral artery; ICA, internal carotid artery; PCA, posterior cerebral artery. Data were presented as mean ± SEM, n = 8, ###P < 0.001 vs. control; ∗P < 0.05, ∗∗P < 0.01, and ∗∗∗P < 0.001 vs. vehicle.

