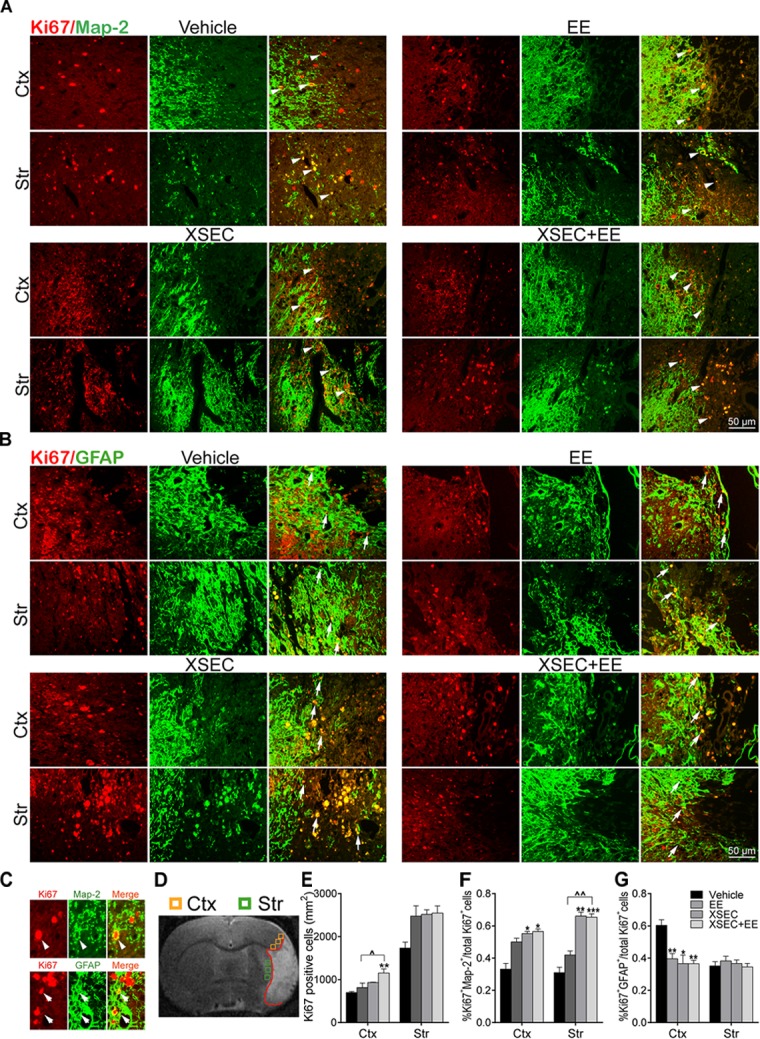
FIGURE 4.

Effect of combination treatment with XSEC and EE on the endogenous neurogenesis in MCAO rats. (A,B) Typical photographs of double immunofluorescent staining for Map-2/Ki67 and GFAP/Ki67 in the peri-infarct cortex and striatum (white arrows indicated co-located cells). (C) Magnified images of co-expressed cells of Map-2/Ki67 + and GFAP/Ki67+ (arrowheads: Map-2/Ki67+ co-expressed cell; arrows: GFAP/Ki67+ co-expressed cell). (D) Schematic diagram of the ischemic brain. The yellow square represents peri-ischemic cortex region and green for striatum that wasdissected for immunofluorescence. (E–G) Quantitative data of the number of Ki67+ cells per mm2 and the percentage of Map-2/Ki67 + and GFAP/Ki67+ co-expression cells divide by total Ki67+ cells numbers in the peri-infarct cortex and striatum. Data were presented as mean ± SEM, n = 4, ∗P < 0.05, ∗∗P < 0.01, ∗∗∗P < 0.001 vs. vehicle; ∧P < 0.05, ∧∧P < 0.01 vs. XSEC+EE.
