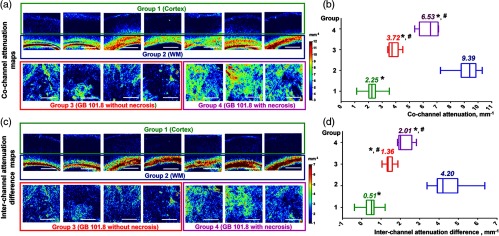
Fig. 5.
Variability of color-coded maps of (a) cochannel attenuation and (c) interchannel attenuation difference in four groups of tissues: normal cortex (group 1), normal white matter (group 2), glioblastoma without necrosis (group 3), and glioblastoma with necrosis (group 4). The distribution of (b) cochannel attenuation and (d) interchannel attenuation difference coefficient values between different tissue types. Data are presented as medians with 25th and 75th percentile values. *Significant differences between white matter and other groups (); #significant differences between the cortex and groups with glioblastoma (). Scale bars 1 mm.

