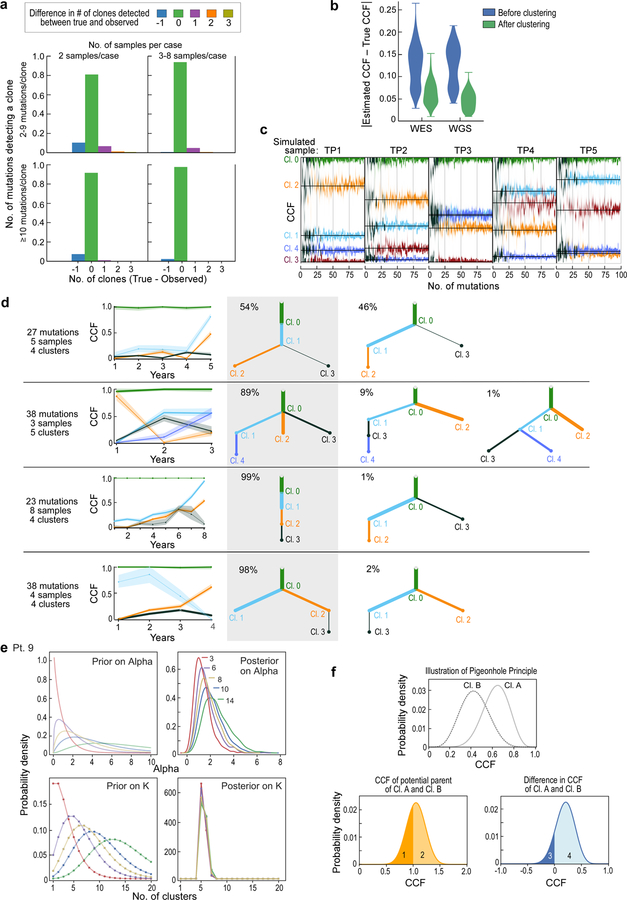
Extended Data Figure 5. Detecting subclones and construction of evolutionary phylogenies using simulated data.
a, Bar plots showing the fraction of clustering results on simulated samples that are concordant with the ground truth (or differ by ∆n clusters). Simulations are grouped by low (2) and high (3–8) number of samples per case as well as low (2–9) and high (≥10) number of mutation per subclone. b, Similar CCF accuracy after clustering between simulated WES and WGS data. c, Simulation of a case with 5 samples and 5 subclones present at different CCF levels per sample (black lines- ground truth). The predicted CCF distributions for each cluster are plotted as a function of the number of mutations in the subclone (from 2 to 100). When the number of mutations exceeds ~15–20, the CCF predictions become stable and accurate (low bias and variance). d, Examples of PhylogicNDT BuildTree algorithm results applied to simulated data. Grey shading highlights the correct tree, with percentage of MCMC iterations supporting the trees indicated. e, Analysis of prior selection for clustering and pigeon-hole principle - For a range of priors with varying mean number of clusters, K, the prior for ⍺ is computed, and the Dirichlet Process posteriors for ⍺ and K illustrate how the choice of prior impacts the estimation of K. f, Pigeon-hole principle: for two clusters, A and B (top), the convolution (middle) and difference (bottom) is illustrated. The area above 1.0 CCF of the convolution is consistent with the probability that they are parent-child rather than siblings. The area below 0.0 CCF of the difference represents the probability that cluster B is more prevalent than cluster A.

