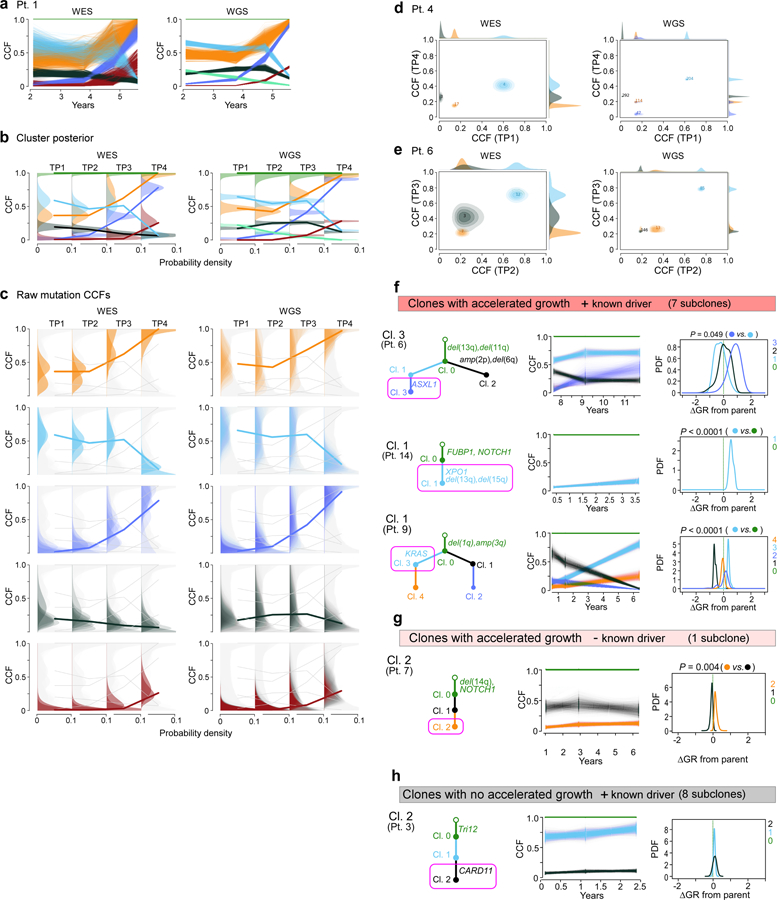
Extended Data Figure 9. Comparison of PhylogicNDT Clustering results between WES and WGS data.

a, In Patient 1, paired results of WES and WGS data were available for all four timepoints and demonstrate matching cancer cell fractions (CCFs) throughout. CCF posterior distributions for the cluster centres (b) and individual mutations (c) for the corresponding subclones found in WES and WGS data of Patient 1. For Patients 4 and 6, two-dimensional comparisons are illustrated (d, e). Examples for subclones (magenta boxes) with f, significant growth advantage relative to their parent and known driver g, one subclone with significantly accelerated growth but no driver and h, subclones with driver and no growth acceleration.
