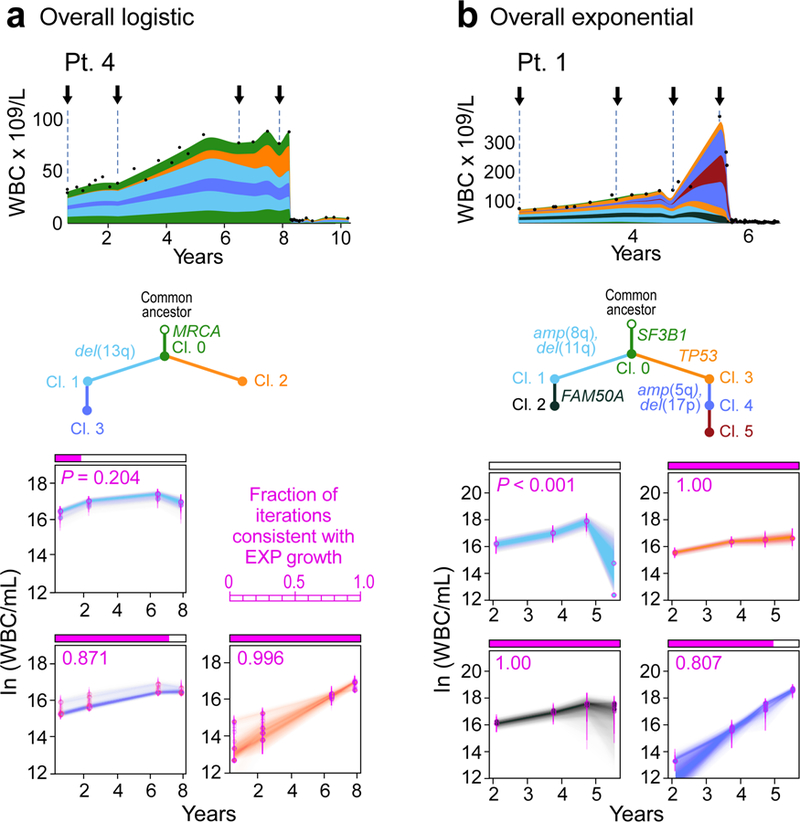
Figure 4. Subclonal growth patterns in untreated CLLs.

Subclonal CLL growth patterns, estimated using PhylogicNDT, in overall logistic growth (a) and overall exponential growth (b). P-values represent significance of rejecting the null hypothesis of exponential growth, based on the proportion of Markov Chain Monte Carlo (MCMC) iterations (magenta). The natural logarithms of numbers of cells in each clone (WBC/mL) are plotted against years from diagnosis. Error bars and trajectories represent uncertainties estimated by the MCMC. Analysis of Patients 5, 18 and 19 in Extended Data Figure 6b, and associated WGS analysis in Extended Data Figures 8–9.
