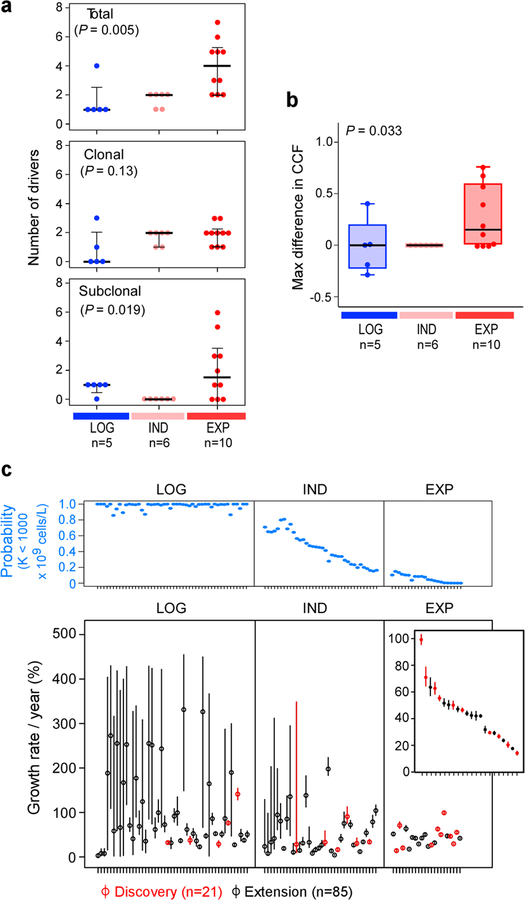
Extended Data Figure 3. Clonal shifts and growth rates in untreated CLL patients.
a, The increase in numbers of total (upper panel), clonal and subclonal drivers (middle and bottom panels) is associated with overall leukaemia growth patterns (Kruskal-Wallis test). b, A trend towards increased maximal change in the CCF of a driver event is observed between the first and last pre-treatment samples of a given patient based on growth pattern (Kruskal-Wallis). c, Upper panel: Probability for having a carrying capacity K of WBC < 109 cells/L (blue dots) for patients with logistic (LOG), indeterminate (IND) or exponential (EXP) growth patterns. Bottom panel: Growth rates (small circles) together with 70% credible intervals (lines) across the discovery and extension samples, ordered based on probability of logistic growth with samples classified as displaying logistic (LOG) growth, indeterminate growth (IND) or exponential growth.

