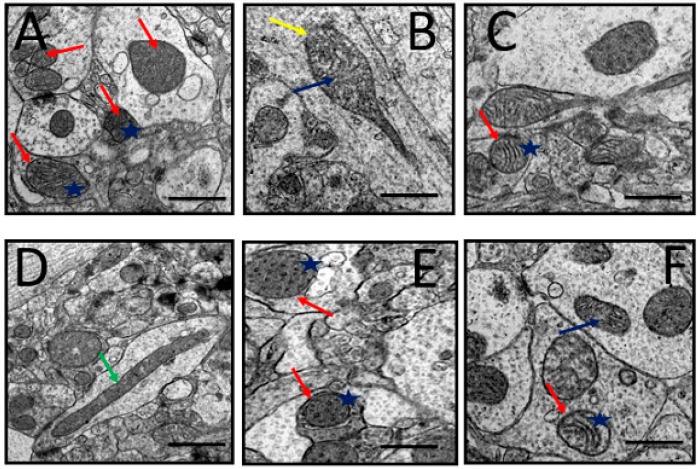
Figure 6.
Representative TEM images depicting rat’s prefrontal cortex showing neuronal mitochondrial abnormalities after exposure to D-gal and AlCl3 and those co-administered with donepezil and CA. (A) Control group: Normal mitochondrion (red arrow) with homogenous dense matrix, organized cristae (blue star), and double mitochondrial membrane. (B) Model group: Showed degenerated cristae (blue arrow) and ruptured mitochondrial membrane (yellow arrow). (C) Donepezil group: Showed normal and abnormal mitochondria. (D) CA 200 group: Showed elongated mitochondria (green arrow). (E,F) CA 400 and CA 800 groups, respectively: Showed normal mitochondria (red arrows) and well-organized cristae (blue star). Scale bar 0.5 µm.

