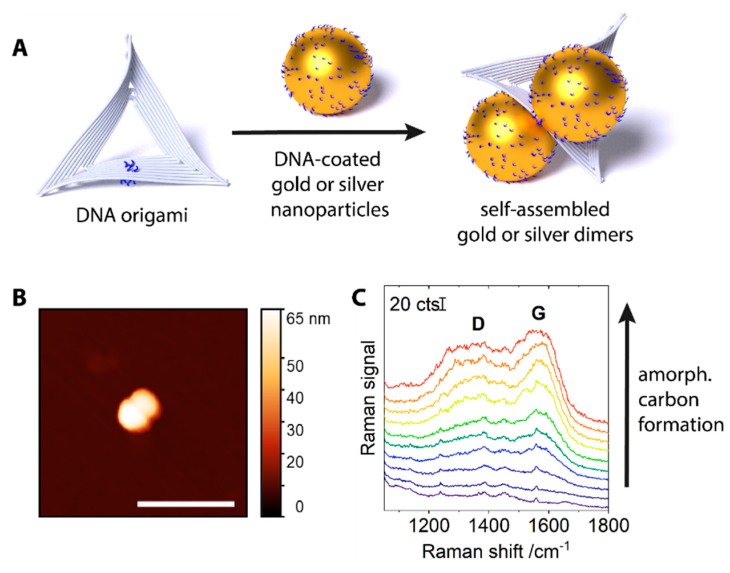
Figure 1.
(A) Assembly scheme for 60 nm gold and silver dimers. (B) Atomic force microscopy (AFM) image of a gold dimer. Scale bar: 300 nm. (C) Average SERS signals of consecutive scans over an area of 170 × 190 μm2 with 60 nm silver dimers, demonstrating the gradual increase of the amorphous carbon signal (bottom to top, D and G band annotated, 532 nm irradiation, 450 kW cm−2, 0.2 s integration per spot). Spectra are offset for clarity.

