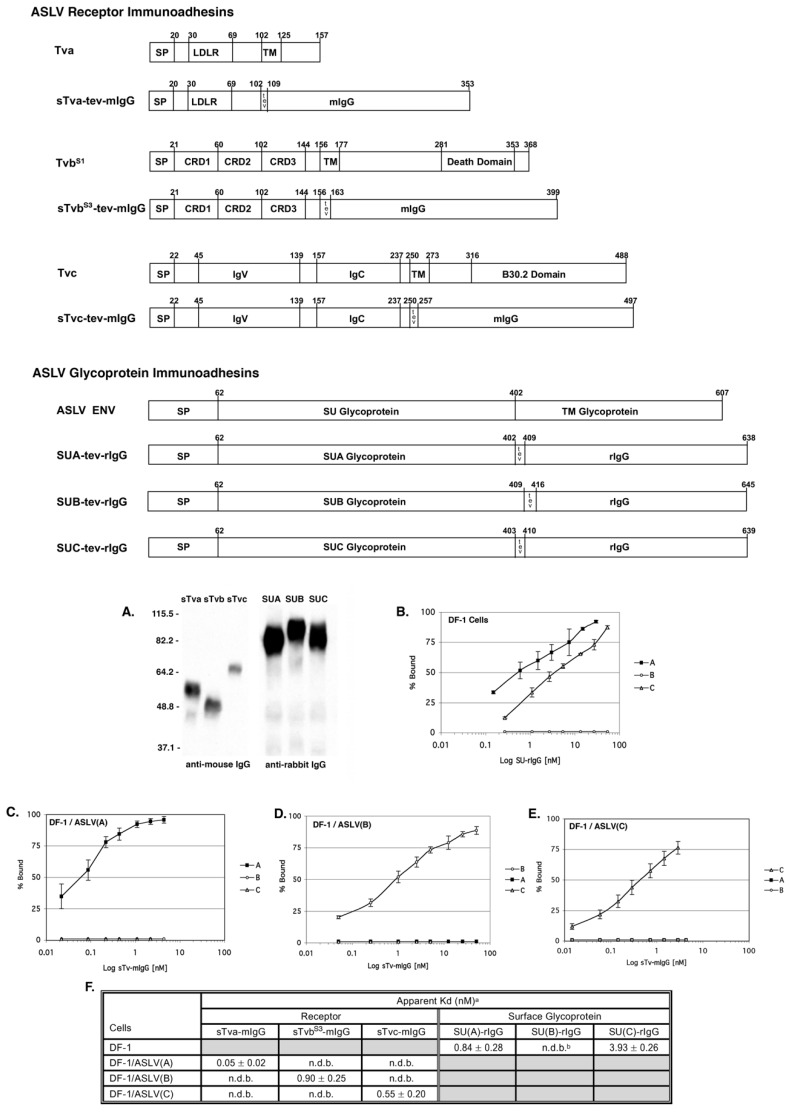
Figure 5.
Schematic representations and binding affinities of ASLV receptor and glycoprotein immunoadhesins. (A) Western immunoblot analysis of the soluble forms of the chicken Tva receptor, sTva-mIgG (sTva), the TvbS1 receptor, sTvbS1-mIgG (sTvb) and the Tvc receptor, sTvc-mIgG (sTvc), immunoprecipitated with anti-mouse IgG-agarose beads, and the secreted forms of the SU glycoproteins SU(C)-rIgG (SUC), SU(A)-rIgG (SUA), and SU(B)-rIgG (SUB) immunoprecipitated with anti-rabbit IgG-agarose beads. The precipitated proteins were denatured, separated by SDS-12% PAGE, and transferred to nitrocellulose. The filters were probed with either peroxidase-conjugated goat anti-mouse IgG or goat anti-rabbit IgG, and the bound protein–antibody complexes visualized by chemiluminescence using Kodak X-Omat film. Molecular sizes (in kilodaltons) are given on the left. (B–E) Uninfected DF-1 cells (B) and DF-1 cells chronically infected with either ASLV(A) (C), ASLV(B) (D), or ASLV(C) (E) and uninfected DF-1 cells (B) were fixed with paraformaldehyde and incubated with different amounts of each secreted SU-rIgG (B) or each soluble receptor–mIgG (C–E). The receptor–viral glycoprotein complexes were bound to either goat anti-mouse IgG or goat anti-rabbit IgG linked to phycoerythrin. The amount of phycoerythrin bound to the cells was measured by FACS, and the maximum fluorescence was estimated. The data were plotted as percent maximum fluorescence bound versus concentration of the soluble receptor–mIgG or secreted SU-rIgG. The values shown are averages and standard deviations (error bars) of three experiments. (B) A, SU(A)-rIgG; B, SU(B)-rIgG; C, SU(C)-rIgG. (C–E): A, sTva-mIgG; B, sTvbS1-mIgG; C, sTvc-mIgG. (F) Estimated binding affinities of the soluble forms of the ASLV receptors for ASLV envelope glycoproteins expressed on the surface of infected DF-1 cells, and soluble forms of the ASLV surface glycoproteins for endogenous levels of the ASLV receptors expressed on DF-1 cells. a Apparent Kd values were estimated by fitting the data via nonlinear least squares to a log logistic growth curve function as described in Materials and Methods. Each result is the average and standard deviation from three experiments. b n.d.b.—no detectable binding. Gray fields indicate binding reactions not performed.

