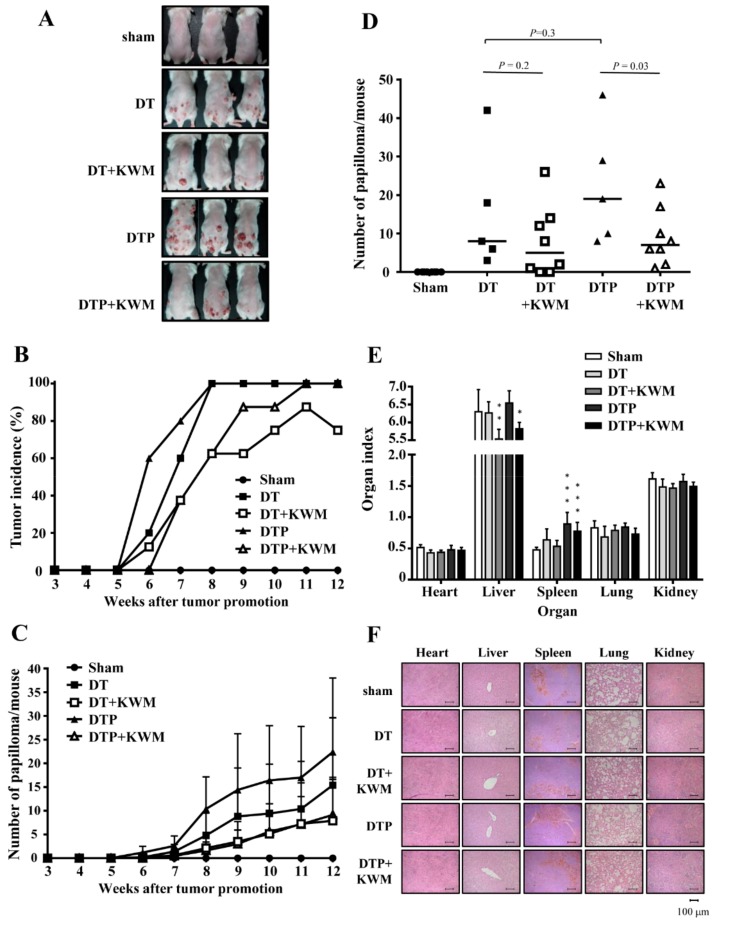
Figure 3.
Effect of KWM-EO on two-stage skin carcinogenesis in mice. (A) Representative images of mice from each group at week 12 are shown. Tumor incidence (B) and mean number of papillomas (C) per group during the experimental period are calculated. (D) Papilloma numbers per mouse at week 12 are shown in the dot histogram. (E) Organ weights were recorded after mice were sacrificed at week 12. Organ index was calculated by the following formula: empty. P* < 0.05, P** < 0.01, P*** < 0.001 compared to sham group (ANOVA). (F) Organ tissues were detected by H&E staining. The DT and DTP groups consisted of 5 mice each. Sham, the DT+KWM, and DTP+KWM groups consisted of 8 mice each. The data are presented as mean ± SD. D: DMBA, T: TPA, P: PLX4032. Scale bar: 100 μm.

