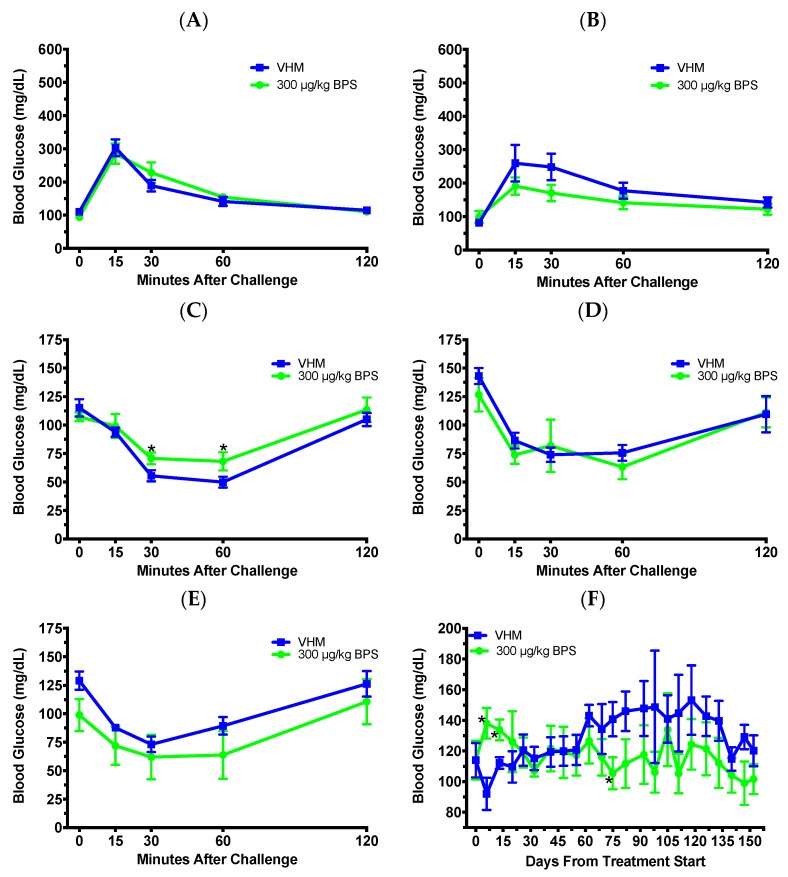
Figure 3.
Tolerance tests and blood glucose levels (BGLs) in male NOD mice on the soy-based diet. GTT after 1 month (A) and 2 months (B) of BPS exposure, and ITT after 1 month (C), 2 months (D) and 5 months (E) of BPS exposure are shown. (F) Time course of non-fasting BGLs. The values are presented as mean ± SEM. *, p < 0.05. N = 5–6. VHM, vehicle males.

