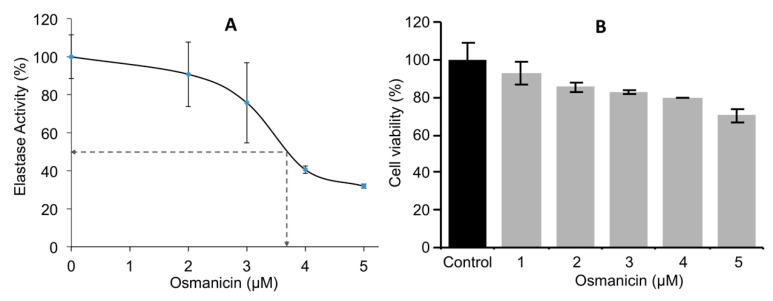
Figure 8.
Determination of the IC50 inhibitory concentration of osmanicin against elastase (A) and cell survival after osmanicin treatment (B). (A) The half maximal inhibitory concentration (IC50) of osmanicin against elastase was calculated by plotting the graph between the different concentrations used (1 μM to 5 μM) and the % inhibition of elastase activity. Data are presented as mean ± SD (n ≥ 3). (B) Relative (%) survival (MTT assay) of BJ fibroblasts exposed to the indicated concentrations of osmanicin for 24 h. Data are presented as mean ± SD (n ≥ 3).

