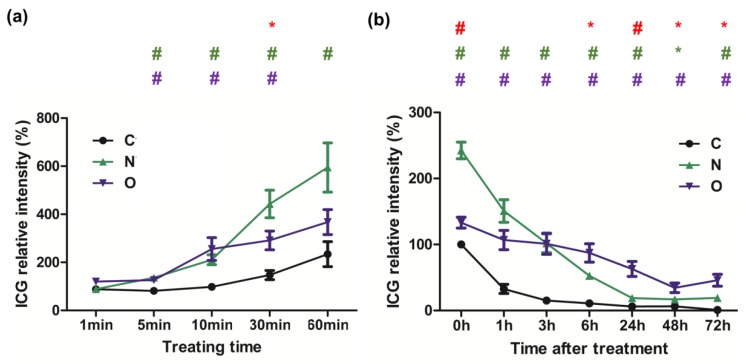
Figure 2.
ICG intake and retention in NTCP- and OATP1B3-expressing HT-29 cells. (a) ICG intensity was detected after ICG treatment for 1, 5, 10, 30, and 60 min in the control and the NTCP- and OATP1B3-expressing HT-29 cells. N = 3. (b) ICG intensity was detected at 0, 1, 3, 6, 24, 48, and 72 h after ICG treatment for 1 h in the control and NTCP- and OATP1B3-expressing HT-29 cells. N = 3. C: control HT-29 cells. N: NTCP-expressing HT-29 cells. O: OATP1B3-expressing HT-29 cells. Error bars represent the standard error of the mean (SEM). * p < 0.05, # p < 0.01. * in purple color indicates control compared with OATP1B3-expressing HT-29 cells. * and # in green color indicate control compared with NTCP-expressing HT-29 cells. * and # in red color indicate NTCP-expressing HT-29 cells compared with OATP1B3-expressing HT-29 cells.

