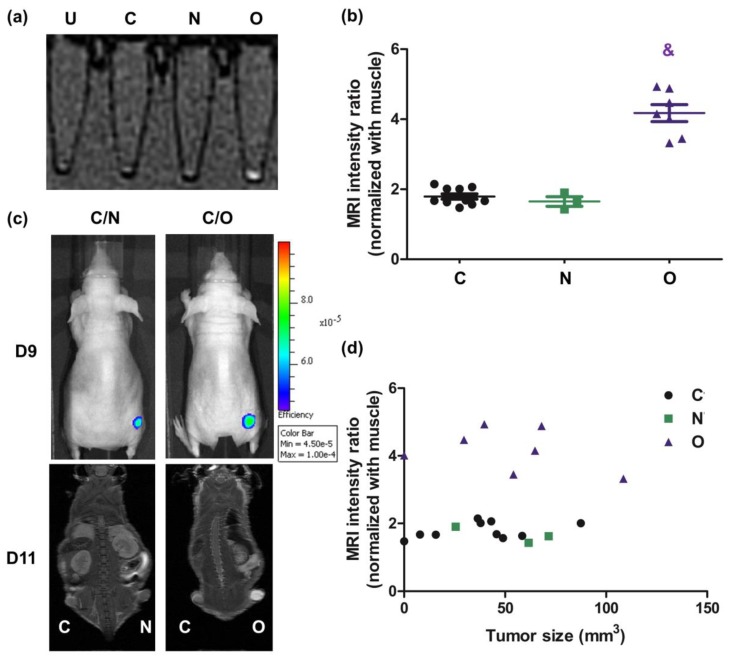
Figure 4.
MRI contrast-Gd-EOB-DTPA intake in vivo in magnetic resonance imaging (MRI). (a) After HT-29 cells were transduced into NTCP and OAT1B3 independently, treated with Gd-EOB-DTPA (MRI contrast) for 4 h, and detected using 3T-MRI scanning. (b) The relative signal intensity of the control and NTCP- and OATP1B3-expressing xenografts adjusted based on the signal intensity of muscles in MR images. Error bars indicate the SEM. N = 8, N = 3, and N = 5 in control, NTCP-expressing tumor cells, and OATP1B3-expressing tumor cells, respectively. (c) ICG intensity was acquired using IVIS 9 d after xenograft. MRI intensity was detected using 7T-MRI approximately 1 h after injecting MRI contrast into NTCP- and OATP1B3-expressing tumor-bearing mice 11 d after xenografting. The tumor on the left hind leg was the control tumor, and on the right was the NTCP-expressing tumor (at the top) and the OATP1B3-expressing tumor (at the bottom). (d) The relationship between tumor size and MRI signal at 1 h after ICG injection into NTCP- and OATP1B3-expressing tumor-bearing mice. C: control HT-29 cells or tumor. N: NTCP-expressing HT-29 cells or tumor. O: OATP1B3-expressing HT-29 cells or tumor. & p < 0.001.

