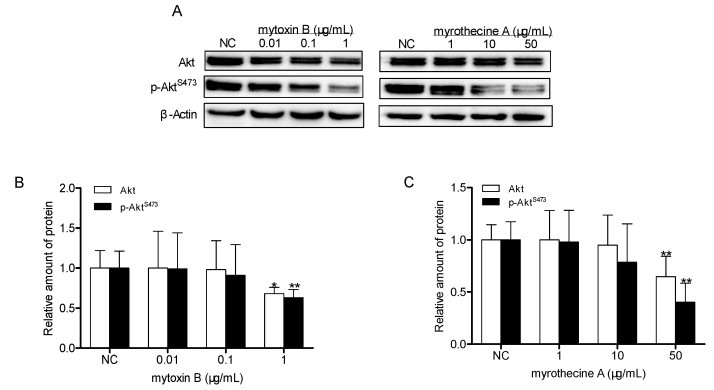
Figure 6.
Effects of mytoxin B and myrothecine A on the expressions of Akt and phosphorylated Akt in SMMC-7721 cells. Cells were treated with different concentration of mytoxin B (0.01, 1, and 10 µg/mL) and myrothecine A (1, 10, and 50 µg/mL) for 24 h, respectively. Cell lysates under various treatments were isolated and analyzed by Western blot analysis (A). Relative amount of Akt and p-AktS473 in mytoxin B-treated cells (B). Relative amount of Akt and p-AktS473 in myrothecine A-treated cells (C). The experiment was independently repeated three times. Compared with negative control (NC), * P < 0.05, ** P < 0.01.

