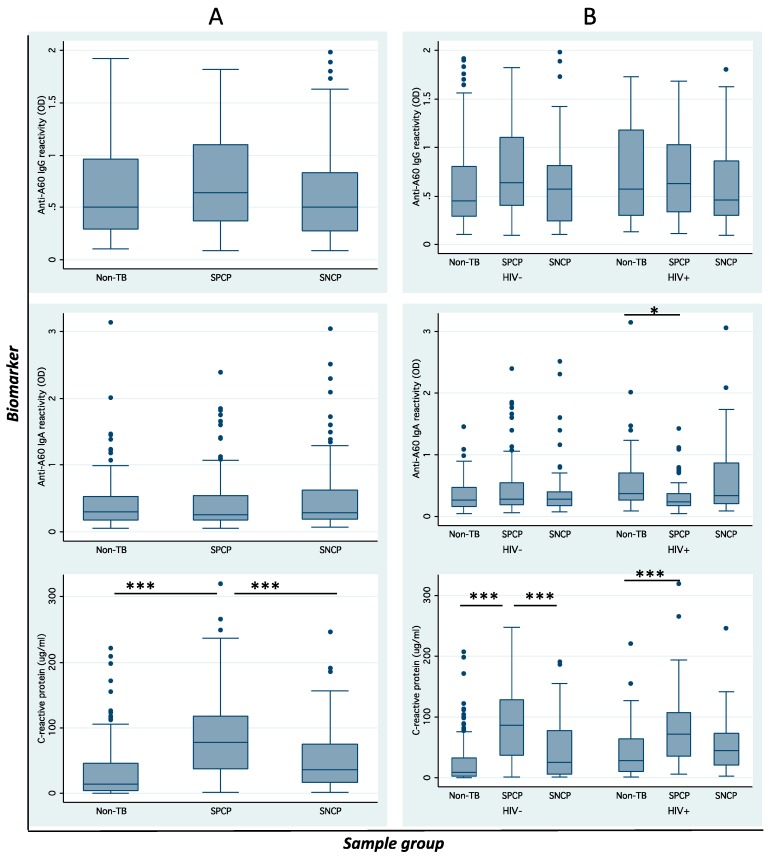
Figure 1.
Biomarker distribution. Boxplots of anti-A60 immunoglobulin G (IgG), anti-A60 immunoglobulin A (IgA) and C-reactive protein (CRP) across diagnostic groups (A) without HIV status and (B) with HIV status taken into account demonstrates influence of HIV on biomarker distribution. Error bars indicate standard deviation. Asterisks indicate statistical significance of p < 0.05 (*), p < 0.01 (**) and p < 0.001 (***). CRP levels >6 μg/mL was considered above normal.

